Cymatics Lab
See Sound. Shape Frequency.
Cymatics Sand Pattern Generator
Explore sound and frequency through an interactive digital cymatics visualization. Generate tones, use your microphone, analyze live audio and watch frequency-driven patterns evolve in real time. When the sound stops, the pattern freezes.
Audio Input
Tone Generator selected. Set the frequency in the panel below and press Play Tone to bring the cymatic field to life.
Frequency
Sound Engine
Ambient layers are synthesized live in your browser with the Web Audio API — no external audio files are downloaded. They also feed the analyzer, so they shape the cymatic field.
Binaural Beats
Noise
All noise colours are generated locally from procedurally filtered buffers. Visual Mix sends extra noise energy to the analyzer only, adding grain turbulence to the field without changing the listening level.
Frequency Presets
Preset values are simply audible tone frequencies used as visualization inputs. No health or therapeutic claims are made or implied.
Live Analysis
Visual Mode
Granular sand accumulating along low-motion nodal regions of a vibrating plate model.
Presets
Field Controls
Chladni Parameters
Advanced Lab
Adaptive quality automatically reduces particle count if the frame rate drops below target.
Capture & Export
What this tool does
This is a digital cymatics-inspired visualization. A mathematical model of standing waves on a vibrating plate drives thousands of simulated grains, which drift away from high-motion antinodes and settle along low-motion nodal lines — the same principle that produces sand figures on a physical Chladni plate. With no sound present the field stays perfectly still.
Real audio analysis
Microphone, audio-file, tone, ambient, binaural and noise sources all pass through a Web Audio AnalyserNode. Dominant frequency is estimated from the FFT magnitude spectrum with parabolic peak interpolation, while bass, mid and treble band energies drive intensity, complexity and fine grain detail.
Scientific note
Patterns shown here are mathematically inspired simulations, not exact reproductions of a physical experiment. Real plate patterns depend on material, thickness, boundary conditions and excitation point. No therapeutic, medical or health claims are made about any frequency, binaural beat or noise colour.
Cymatics Sand Pattern Generator
0.8
Disclaimer:
This chart is for educational and wellness purposes only and does not provide medical advice or treatment.
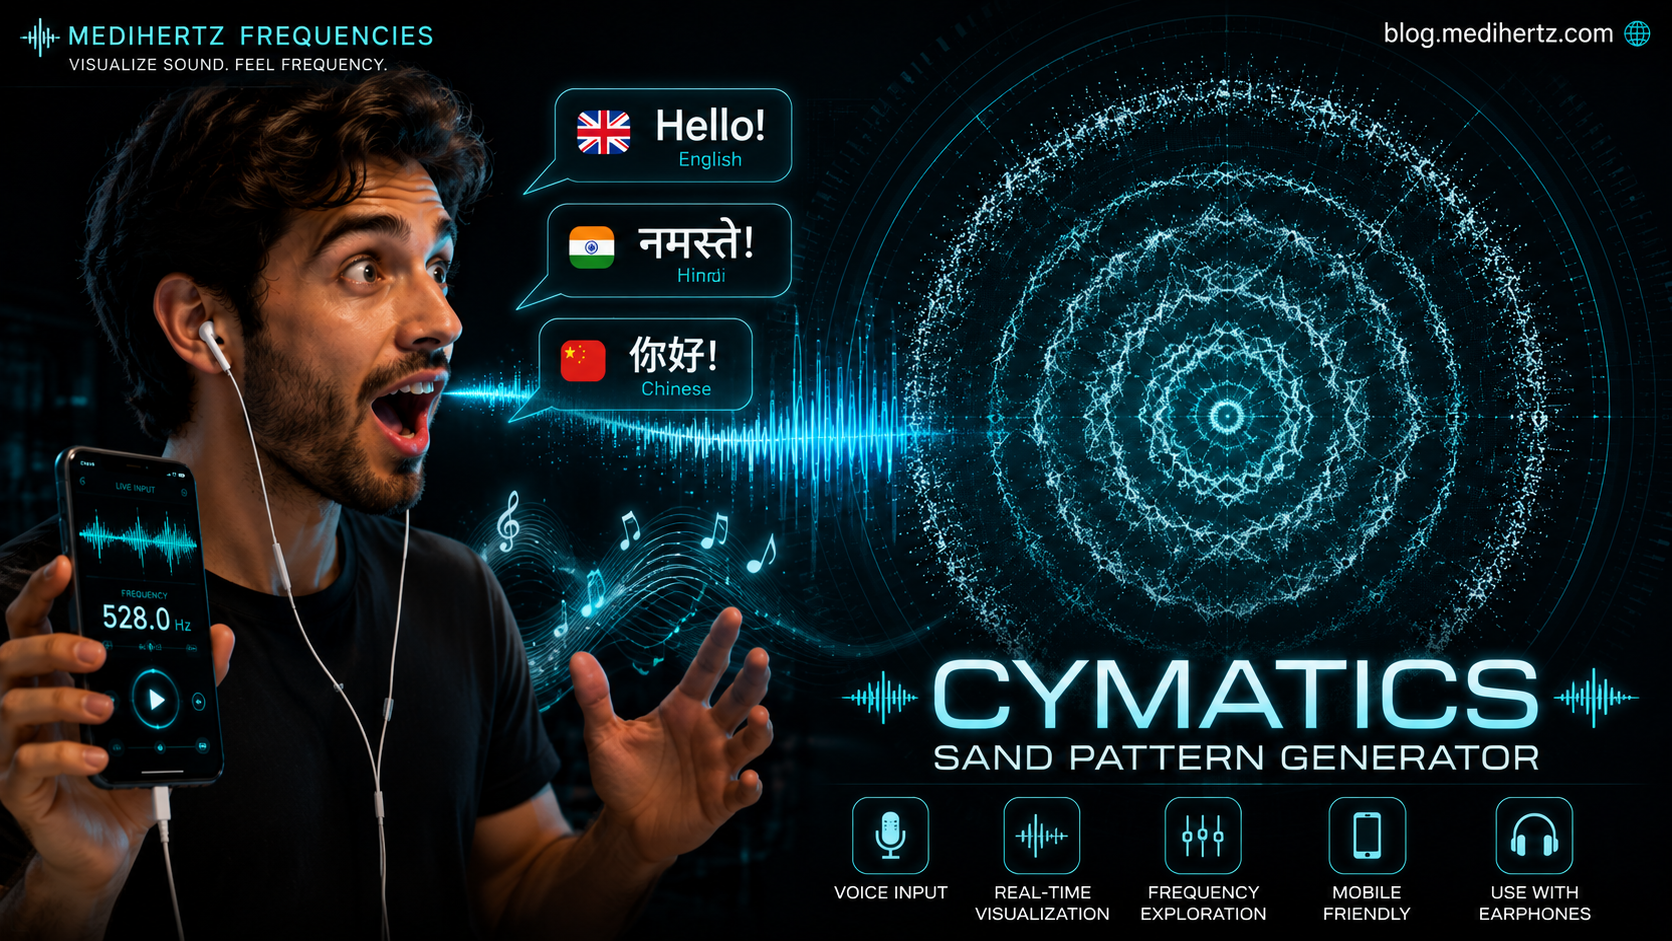
See Sound. Hear Frequency. Watch Patterns.
Explore sound and frequency through an interactive cymatics visualization. Generate tones, use your microphone to analyze your voice and surrounding sounds, play audio, and watch frequency-driven patterns respond in real time.
Speak into your phone. Hum a note. Sing. Chant. Play music. Make a sound.
Then watch your sound become a visual frequency experience.
Generate → Listen → Analyze → Visualize.
🎙️ See Your Own Voice Frequency in Real Time
What happens when you speak into a microphone and watch your voice become a visual pattern?
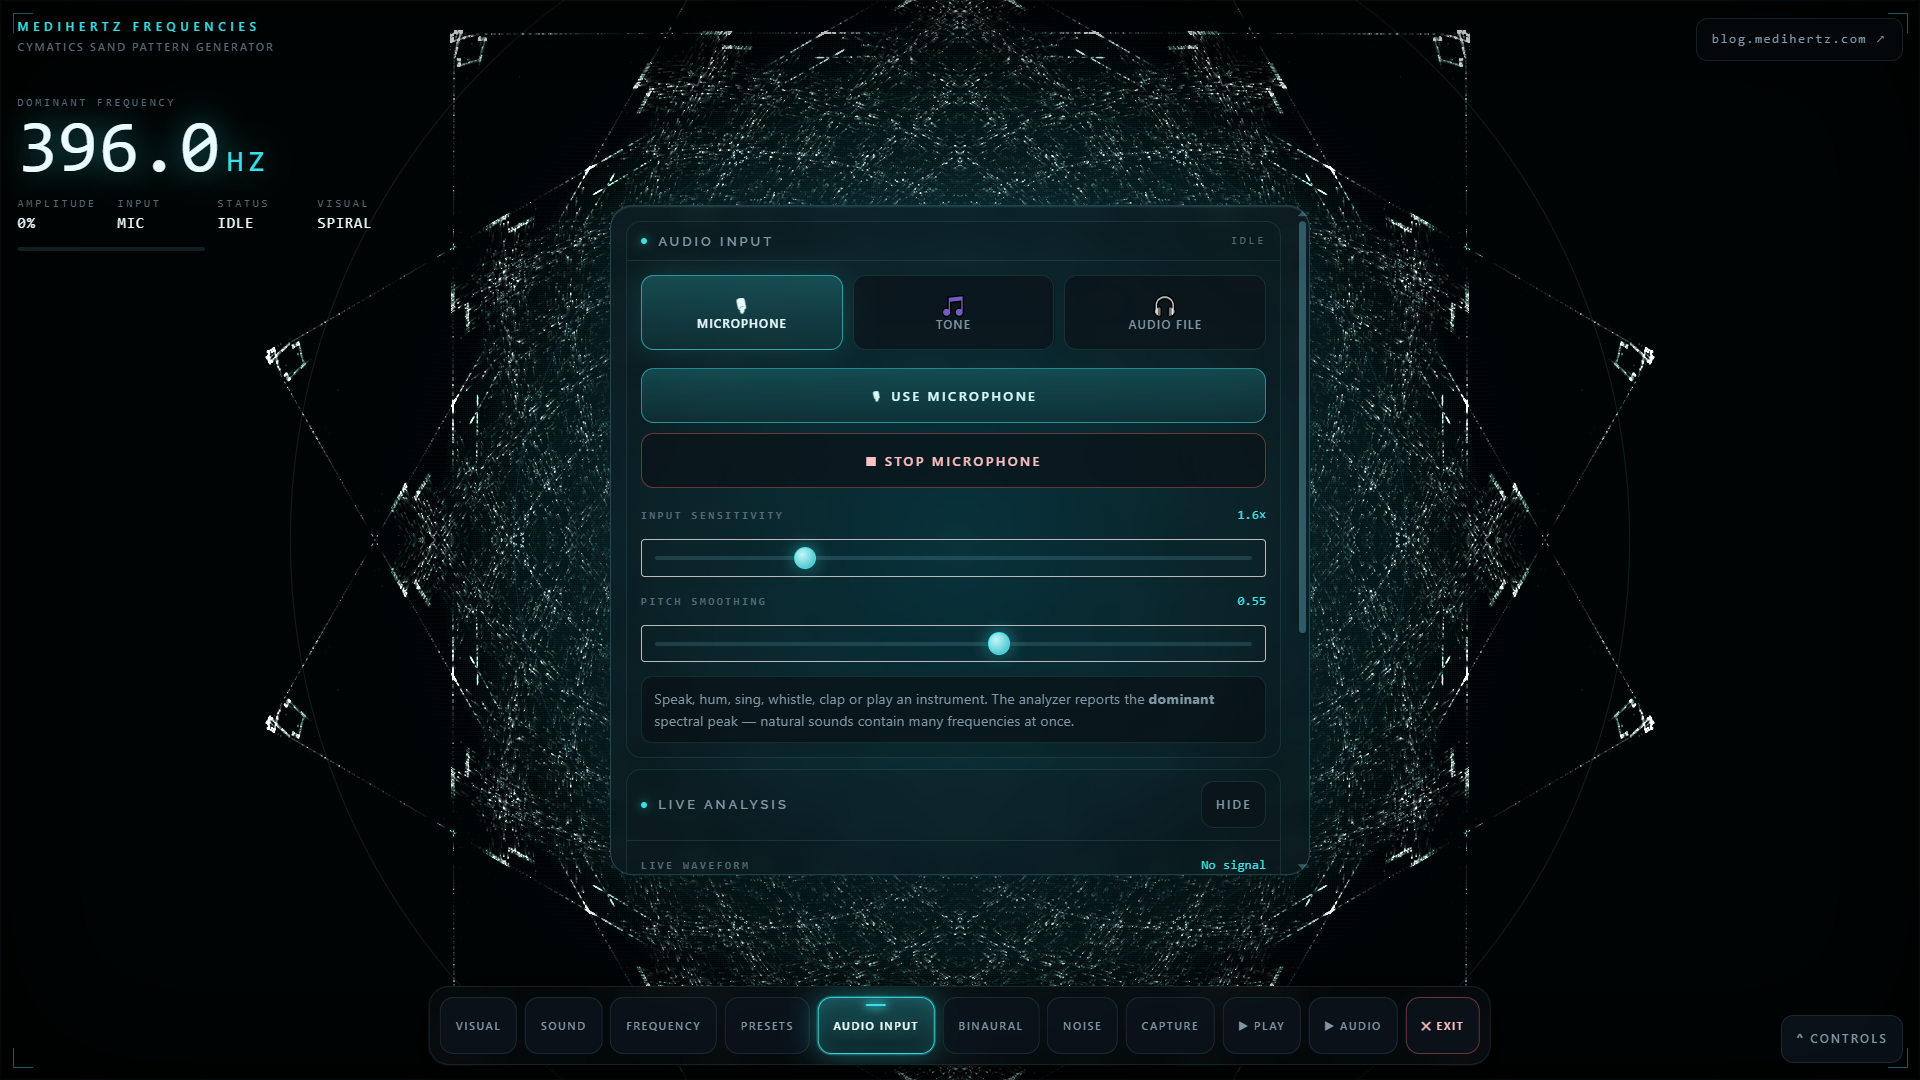
With the Audio Input mode, you can use your phone, tablet or computer microphone to explore the frequency content of sounds around you.
You can:
- Speak normally
- Say your name
- Read a sentence
- Hum a note
- Sing
- Whistle
- Chant
- Recite a mantra
- Clap
- Play an instrument
- Play music
- Capture room ambience
- Explore environmental sounds
As sound reaches the microphone, the tool analyzes the incoming audio and displays its changing frequency information while the cymatic visualization responds.
Try a simple experiment
Say:
“Hello, I am exploring sound frequency.”
Then hum one steady note.
Now change your pitch.
Speak higher.
Speak lower.
Hum again.
Watch how the frequency information and visual response change.
Your voice is not one fixed frequency. Speech contains many frequencies that continuously change as you pronounce different sounds, vowels and consonants.
The purpose of this experiment is to let you see those changes happening live.
🌊 Sound Frequency Experiment — See How Vibrations Create Patterns
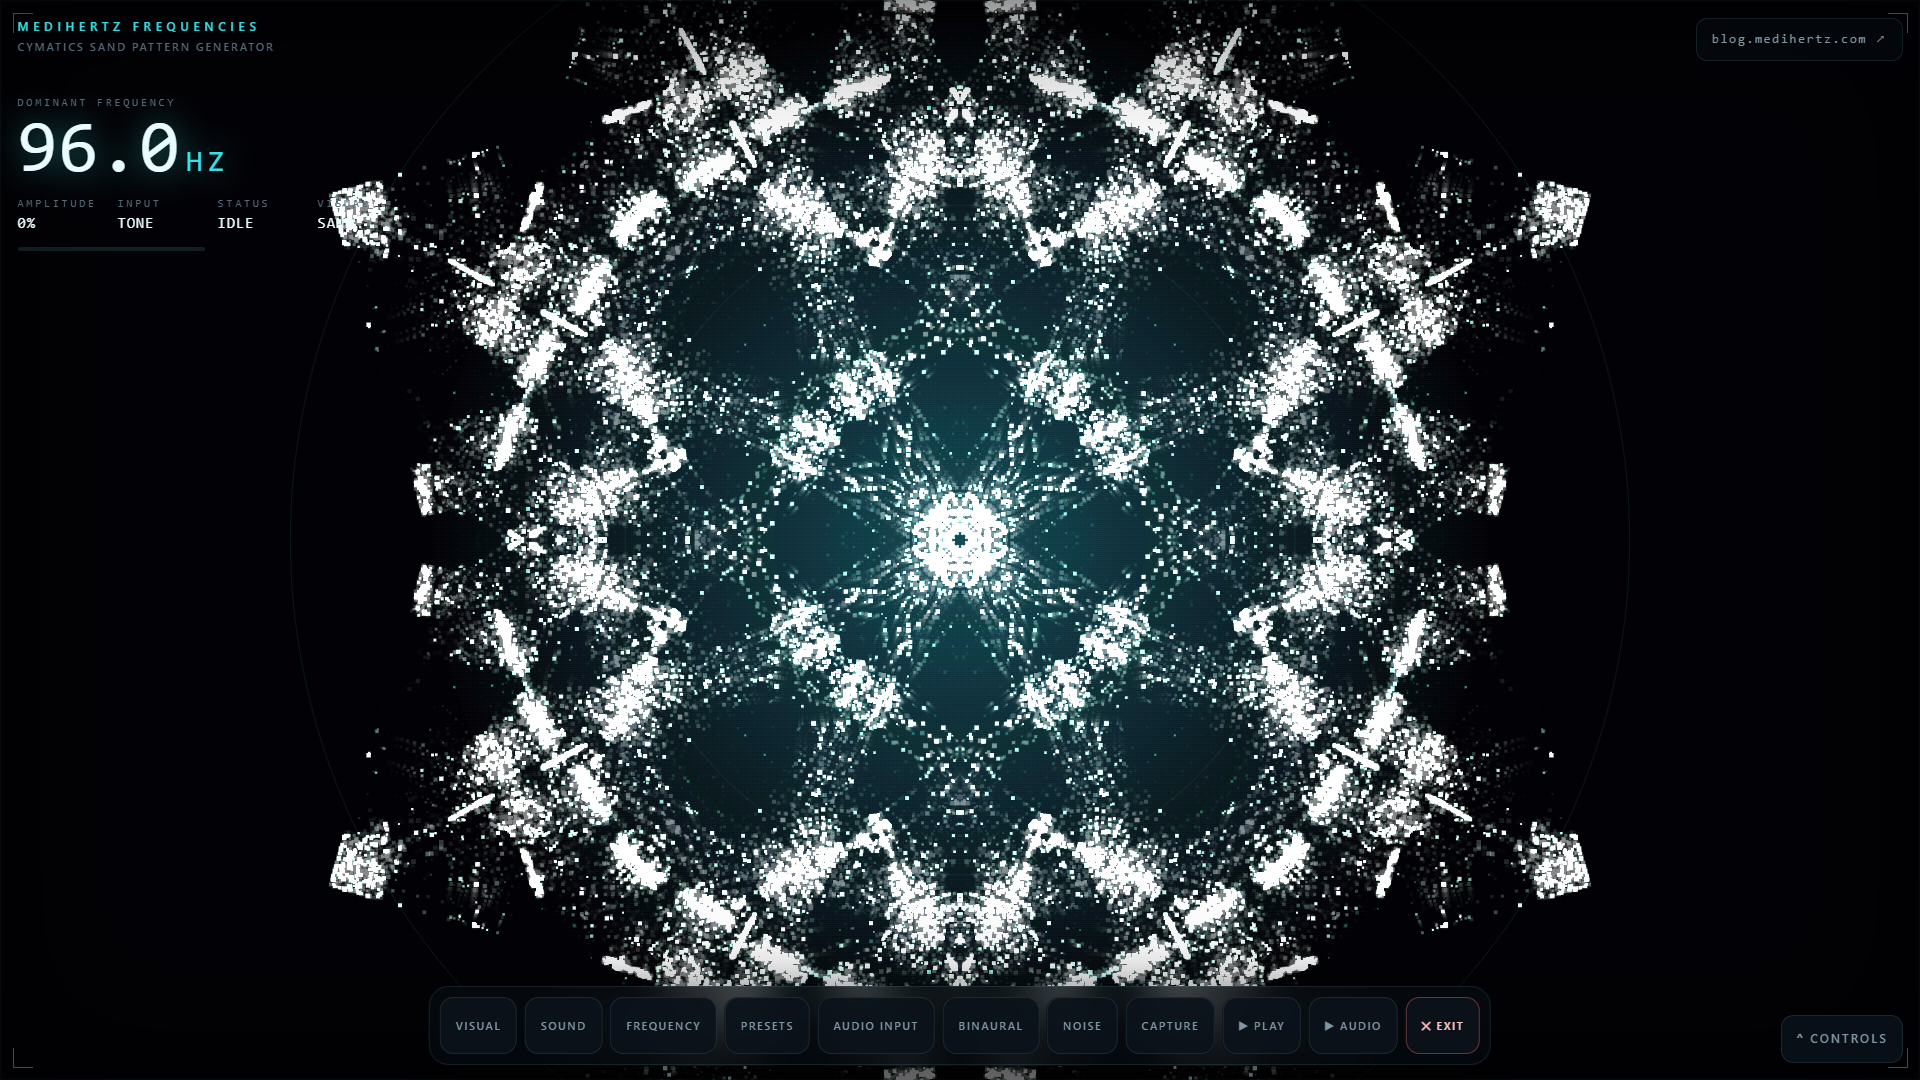
This is an interactive sound frequency and cymatics experiment where you can explore how frequency and vibration can be represented visually.
You can generate a tone directly inside the tool, or use Audio Input to analyze sound coming through your microphone.
That means you can experiment with both controlled frequencies and real-world audio.
Sound can be represented in many ways — as a waveform, spectrum, frequency measurement or visual pattern.
Cymatics takes the idea one step further by showing how vibration can organize matter into visible forms.
And now you can explore the concept interactively without needing a physical sand plate or laboratory setup.
🔊 Voice Frequency Analyzer — What Hz Is My Voice?
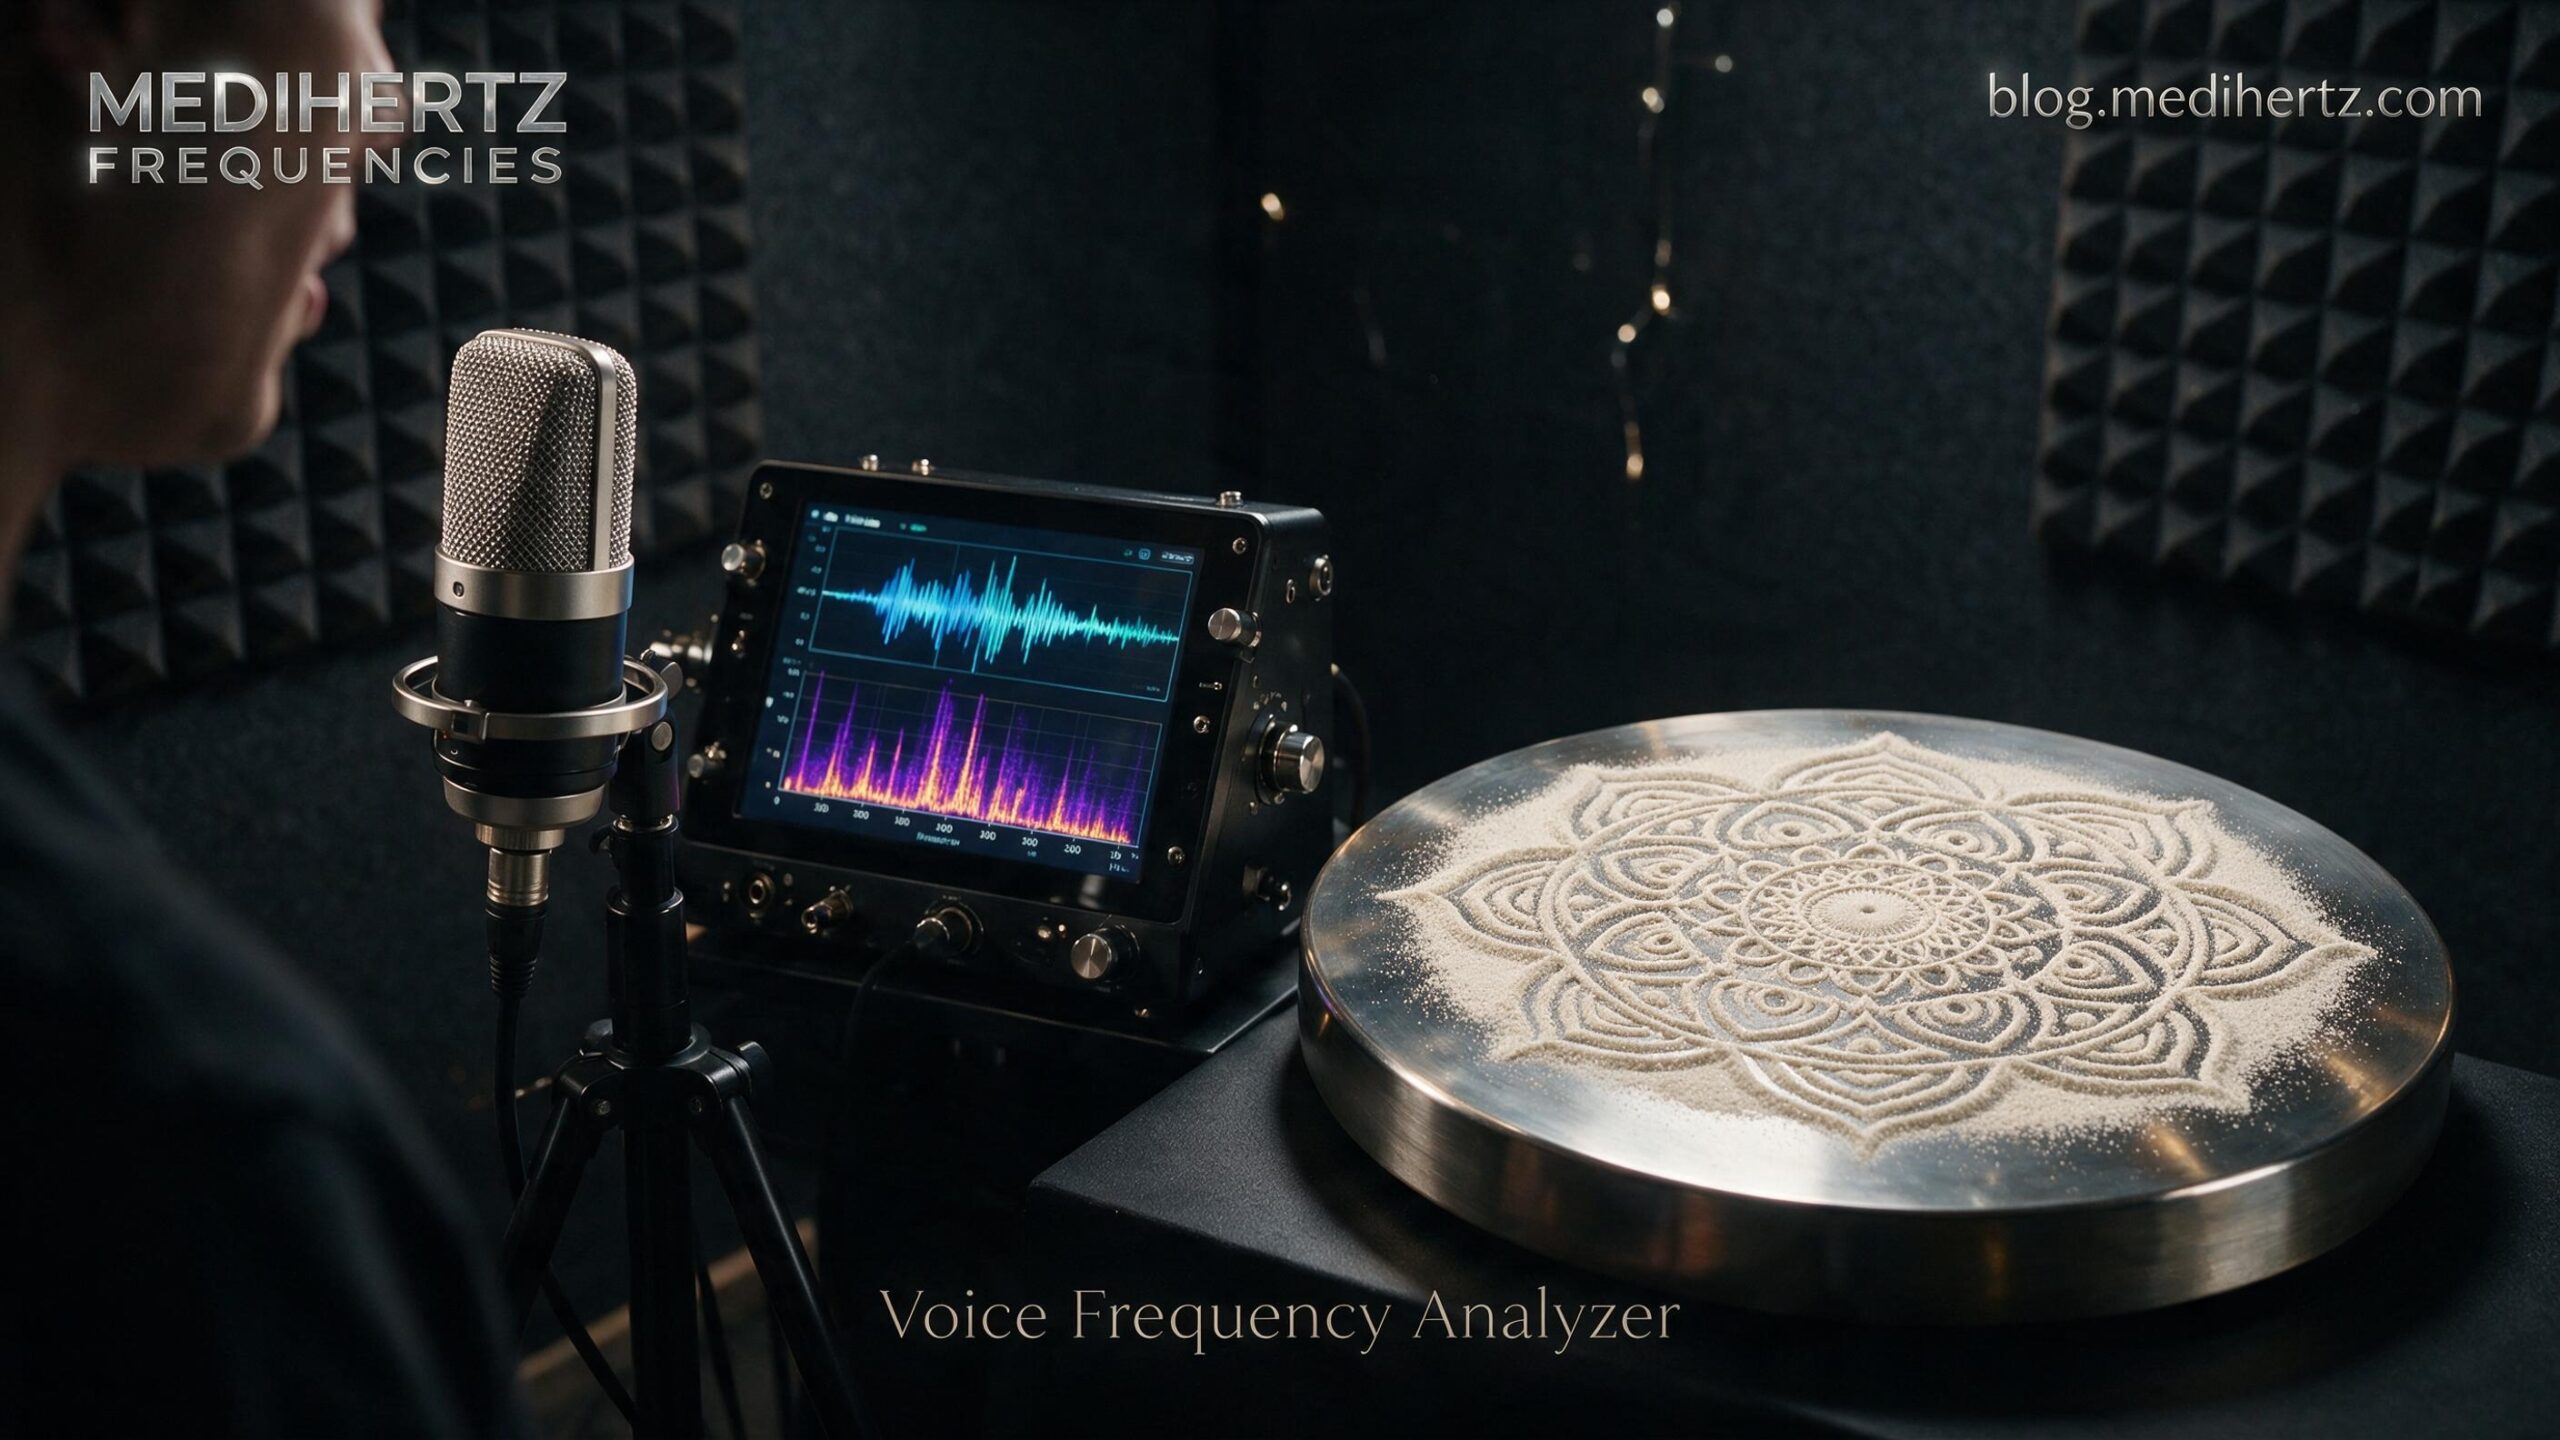
Have you ever wondered:
What is the frequency of my voice?
How many Hz is my voice?
How do I check my voice frequency?
Can I measure my voice frequency online?
The Audio Input mode lets you explore these questions directly from your browser.
Allow microphone access, speak into your device and observe the detected frequency information as your voice changes.
How to check your voice frequency
- Open the Cymatics Sand Pattern Generator.
- Select Audio Input.
- Allow microphone access when your browser asks.
- Speak, hum or sing.
- Watch the dominant frequency change.
- Observe how the cymatic visualization responds.
You can perform the experiment on a phone, tablet or desktop computer.
A headset or earphones with a microphone can also be useful for voice experiments.
Important: Your voice does not have one permanent Hz value
A person’s voice contains many frequency components.
The frequency you see can change depending on:
- Pitch
- Words being spoken
- Vowels and consonants
- Singing
- Humming
- Speaking style
- Microphone position
- Background noise
- Room acoustics
Therefore, the displayed number should be understood as a momentary or dominant frequency detected from the audio, not as a permanent number that defines your voice.
🌊 Sound Visualization — Turn Audio Into Patterns
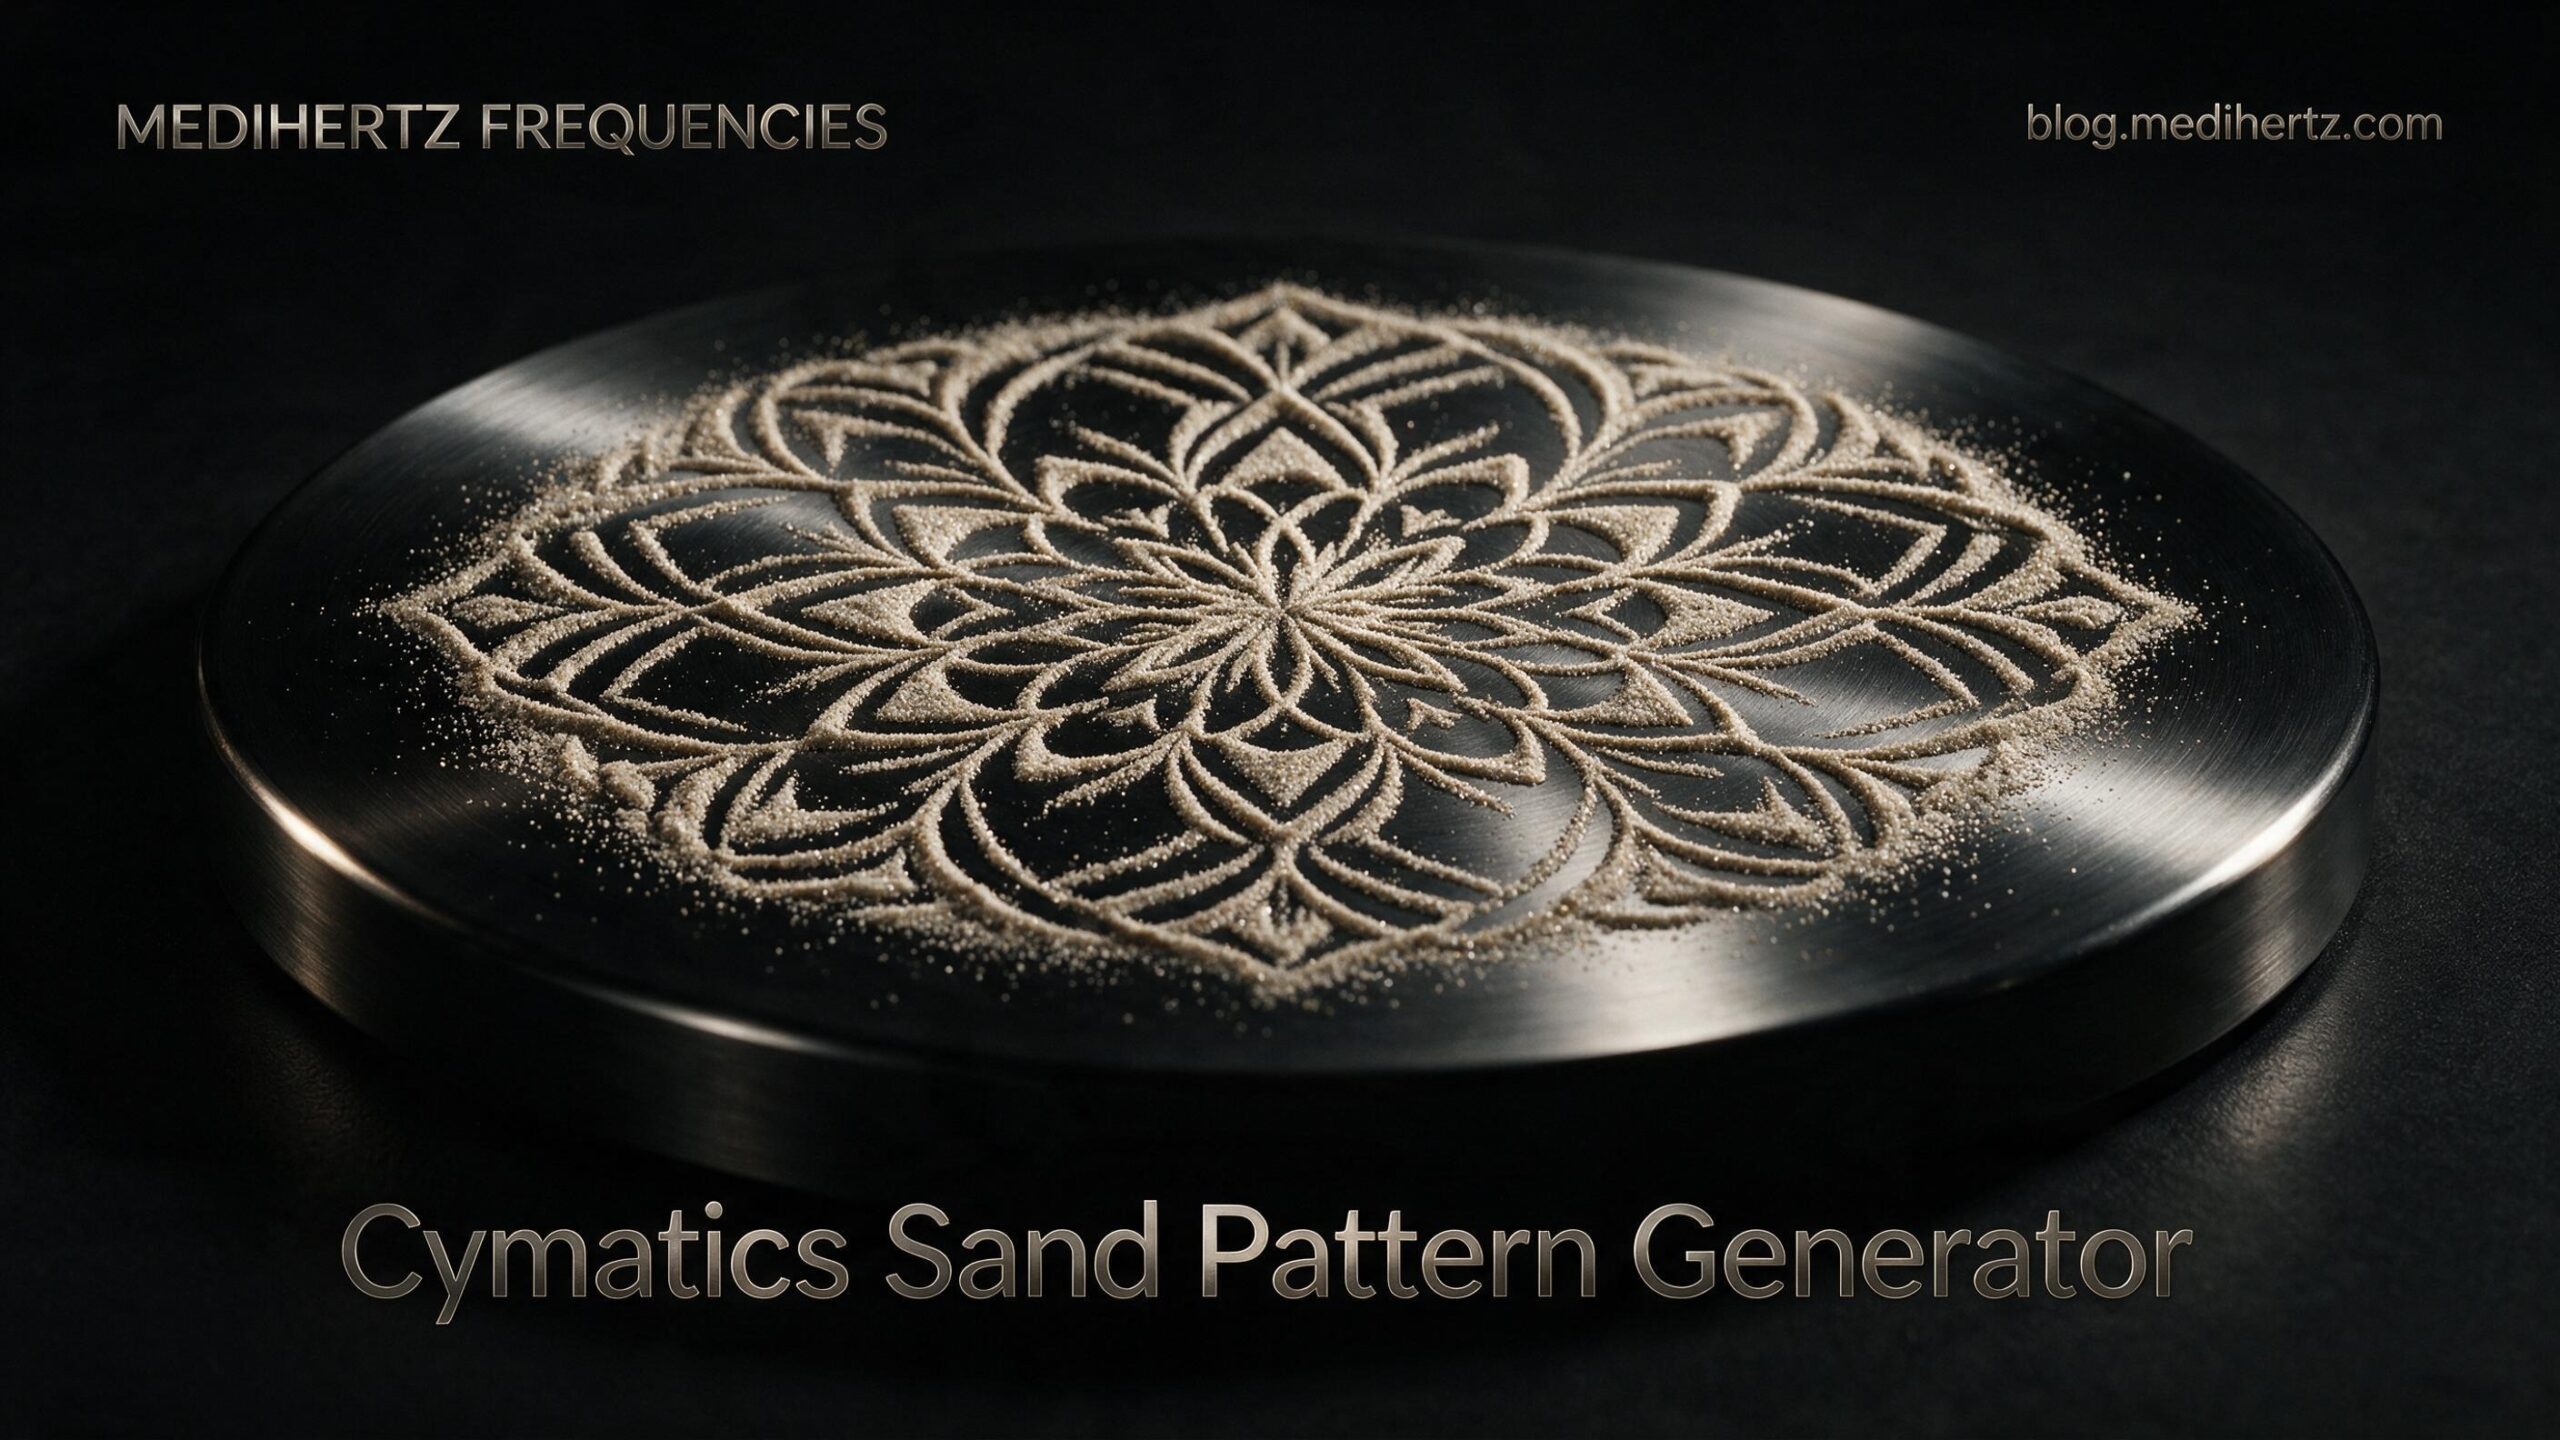
Sound is something we normally experience through hearing.
A sound visualization lets us experience it visually as well.
Different visualization methods reveal different characteristics of an audio signal.
Audio Waveform
A waveform shows how an audio signal changes over time.
Frequency Spectrum
A frequency spectrum shows the frequency components contained within the sound.
Audio Visualizer
An audio visualizer converts changing audio information into moving graphics.
Cymatic Visualization
Cymatics explores how vibration can create visible patterns in physical materials. This digital tool uses an interactive visual simulation inspired by cymatic forms to let you explore sound and frequency visually.
With the Audio Input feature, the experience becomes interactive:
Make a sound → microphone captures it → audio is analyzed → visualization responds.
This makes the tool useful as an educational sound visualization experiment, as well as a creative frequency experience.
Cymatic Frequency Chart
Sleep Frequencies
Focus Frequencies
Healing Frequencies
Spiritual Frequencies
Energy Frequencies
| Frequency | Category | Brainwave | Emotion / Feeling | Best Use | Best Time | Common Listener Experience | Visual Cymatic Pattern | Chakra Association | Scientific Notes |
|---|---|---|---|---|---|---|---|---|---|
| 174 Hz | Healing | Delta | Grounding | Pain relief | Night | Heavy calm feeling | Dense circular waves | Root Chakra | Associated with relaxation support |
| 285 Hz | Healing | Delta | Comforting | Tissue recovery meditation | Evening | Warm body sensation | Soft flower geometry | Sacral Chakra | Used in healing meditation communities |
| 396 Hz | Healing | Theta | Fear release | Stress reduction | Evening | Emotional lightness | Square resonance patterns | Root Chakra | Popular in Solfeggio practices |
| 417 Hz | Healing | Theta | Motivating | Breaking negative thought cycles | Morning | Mental reset feeling | Rotating geometric ripples | Sacral Chakra | Used for mindfulness routines |
| 432 Hz | Sleep | Alpha | Peaceful | Relaxation & sleep | Night | Natural calming sensation | Balanced circular symmetry | Heart Chakra | Widely used relaxing tuning frequency |
| 440 Hz | Focus | Beta | Neutral alertness | Music tuning | Anytime | Normal listening state | Classic resonance lines | None | Standard tuning frequency |
| 528 Hz | Healing | Alpha | Love & emotional warmth | Meditation | Morning | Heart-opening feeling | Flower-like cymatic symmetry | Heart Chakra | Popular “love frequency” claim |
| 639 Hz | Healing | Alpha | Connection | Relationship healing meditation | Evening | Emotional openness | Petal geometries | Heart Chakra | Used in spiritual audio practices |
| 741 Hz | Healing | Beta | Mental clarity | Focus & detox meditation | Morning | Sharper awareness | Star-shaped waves | Throat Chakra | Associated with concentration |
| 852 Hz | Spiritual | Gamma | Awakening | Deep meditation | Night | Heightened awareness | Complex radial symmetry | Third Eye Chakra | Common in spiritual communities |
| 963 Hz | Spiritual | Gamma | Transcendent | Spiritual meditation | Late night | Floating sensation | Sacred geometry-like forms | Crown Chakra | Popular “pineal gland” association |
| Alpha Waves (8–12 Hz) | Focus | Alpha | Relaxed focus | Studying | Afternoon | Calm concentration | Smooth harmonic waves | Third Eye Chakra | Linked with relaxed awareness |
| Beta Waves (13–30 Hz) | Focus | Beta | Alertness | Productivity | Morning | Mental sharpness | Fast vibration patterns | Solar Plexus | Associated with active thinking |
| Theta Waves (4–8 Hz) | Spiritual | Theta | Dreamlike | Meditation | Night | Deep imagination | Fluid ripple geometry | Third Eye Chakra | Linked with deep meditation states |
| Delta Waves (0.5–4 Hz) | Sleep | Delta | Heavy relaxation | Deep sleep | Night | Sleepiness | Slow expanding circles | Root Chakra | Dominant during deep sleep |
| Gamma Waves (30–100 Hz) | Energy | Gamma | High energy | Peak cognition | Morning | Mental intensity | Highly detailed patterns | Crown Chakra | Associated with heightened cognition |
How to Use This Cymatic Frequency Chart
This interactive frequency chart brings together Solfeggio frequencies, brainwave ranges, commonly discussed meditation tones, binaural-beat concepts and cymatic visualization ideas in one place.
Use the chart as a reference for exploring individual frequencies, then try those frequencies inside the generator and observe the visual response.
With the new Audio Input mode, you can also move beyond preset frequencies and experiment with your own voice, music and environmental sounds.
You can scroll horizontally to explore:
- Frequency values
- Brainwave ranges
- Common listening contexts
- Meditation and relaxation associations
- Sleep-related frequency discussions
- Cymatic visualization concepts
- Chakra associations
- Scientific notes
Best experience: Use headphones when experimenting with stereo audio or binaural beats.
Disclaimer: This chart is provided for educational and wellness-oriented exploration. Frequency associations listed here are not medical claims or guaranteed effects.
🎧 Common Sounds You Can Explore With Audio Input
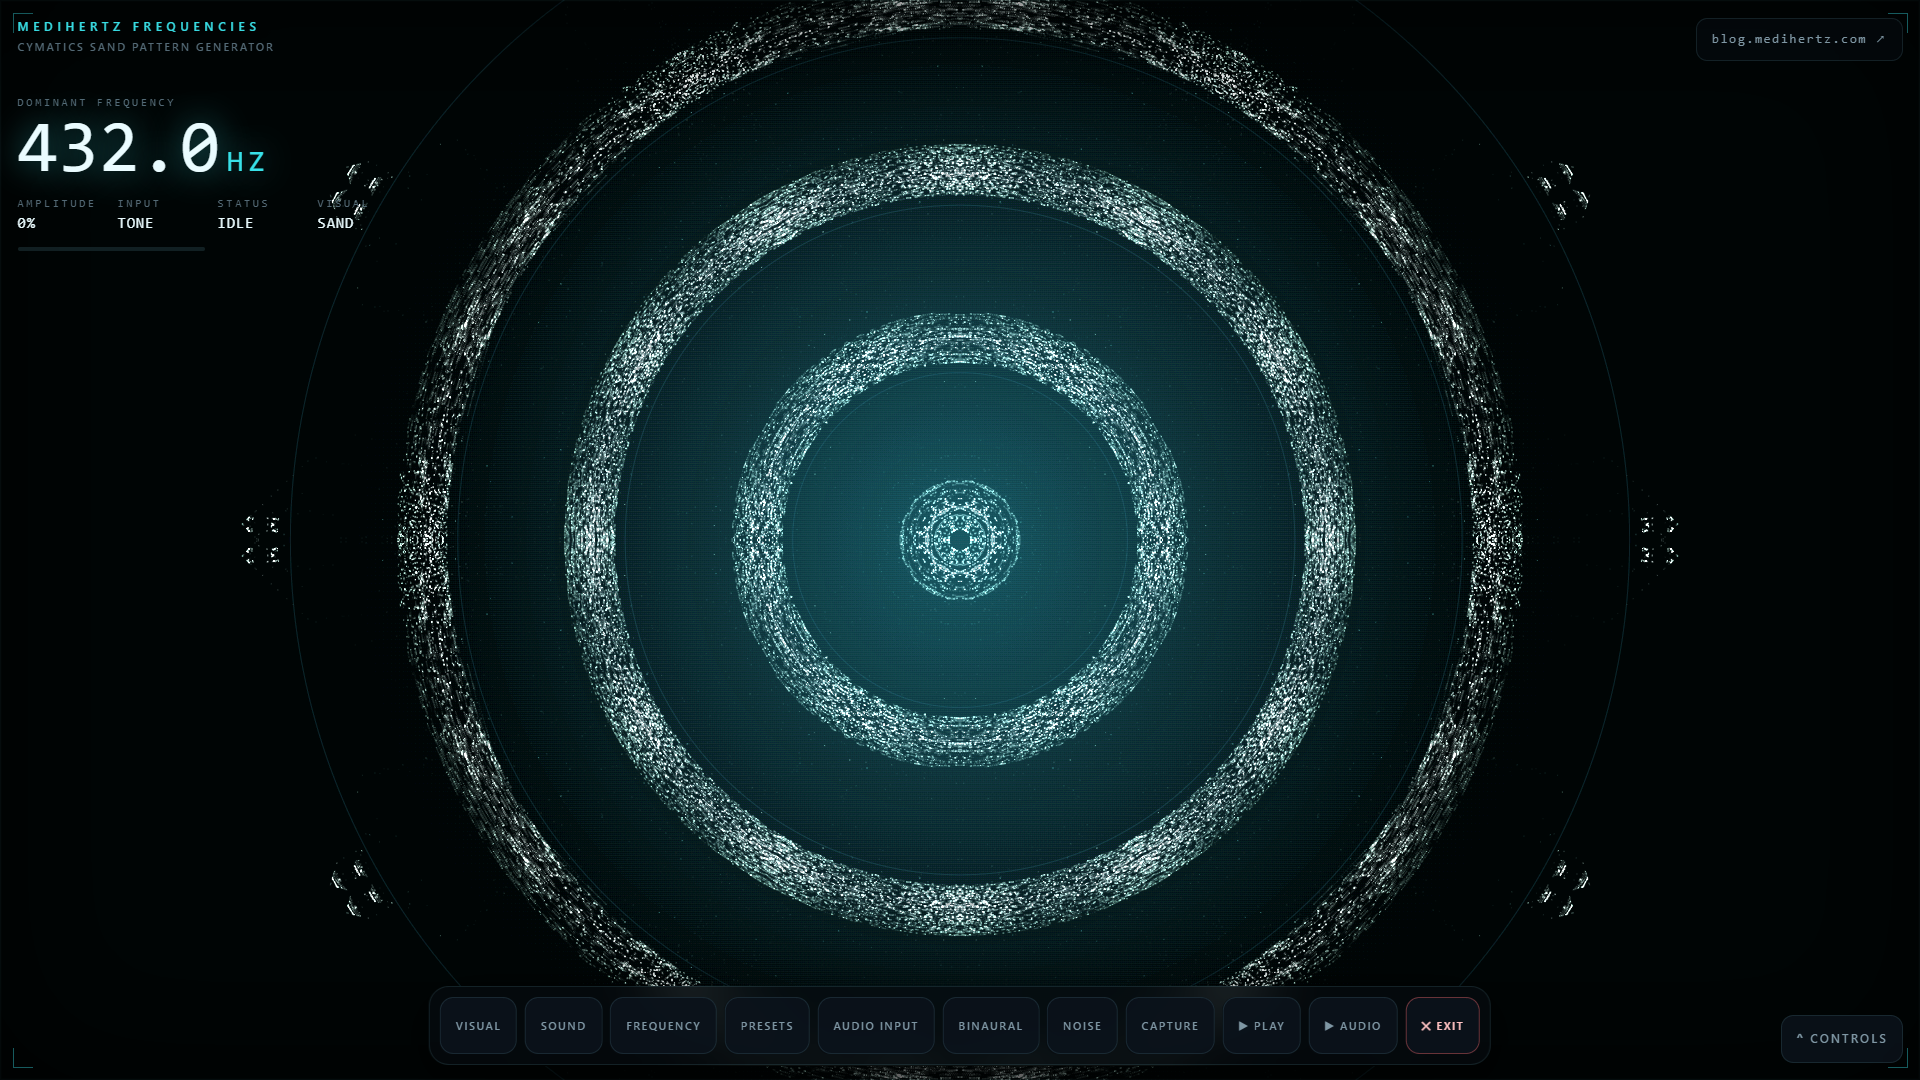
The live Audio Input mode lets you explore much more than generated tones.
| Sound or source | What you can observe |
|---|---|
| Speaking voice | Changing fundamental and harmonic frequency components |
| Singing | Pitch changes and harmonic structure |
| Humming | A more sustained vocal tone |
| Whistling | A prominent tonal frequency |
| Mantras | Repeating vocal sounds and harmonics |
| Chants | Changing pitch, rhythm and harmonic content |
| Bells | Strong tones, harmonics and resonance decay |
| Musical instruments | Fundamental tones and harmonics |
| Music | Multiple frequencies occurring together |
| Room ambience | A mixture of environmental sounds |
| Traffic noise | Complex changing frequency content |
| Fan or motor | Repeating mechanical frequency components |
| White noise | Broad frequency distribution |
| Pink noise | Broad-spectrum noise with relatively more low-frequency energy |
| Brown noise | Noise with stronger low-frequency content |
| Binaural beats | Two-channel tones with a frequency difference between ears |
A useful way to think about it
There is no single “correct” frequency for every sound.
A voice, bell, mantra, instrument, room and piece of music can contain many frequencies simultaneously.
The purpose of Audio Input is to let you observe those changes rather than forcing every sound into a single fixed number.
🎙️ Try Your Own Voice, Mantra, Chant or Sound
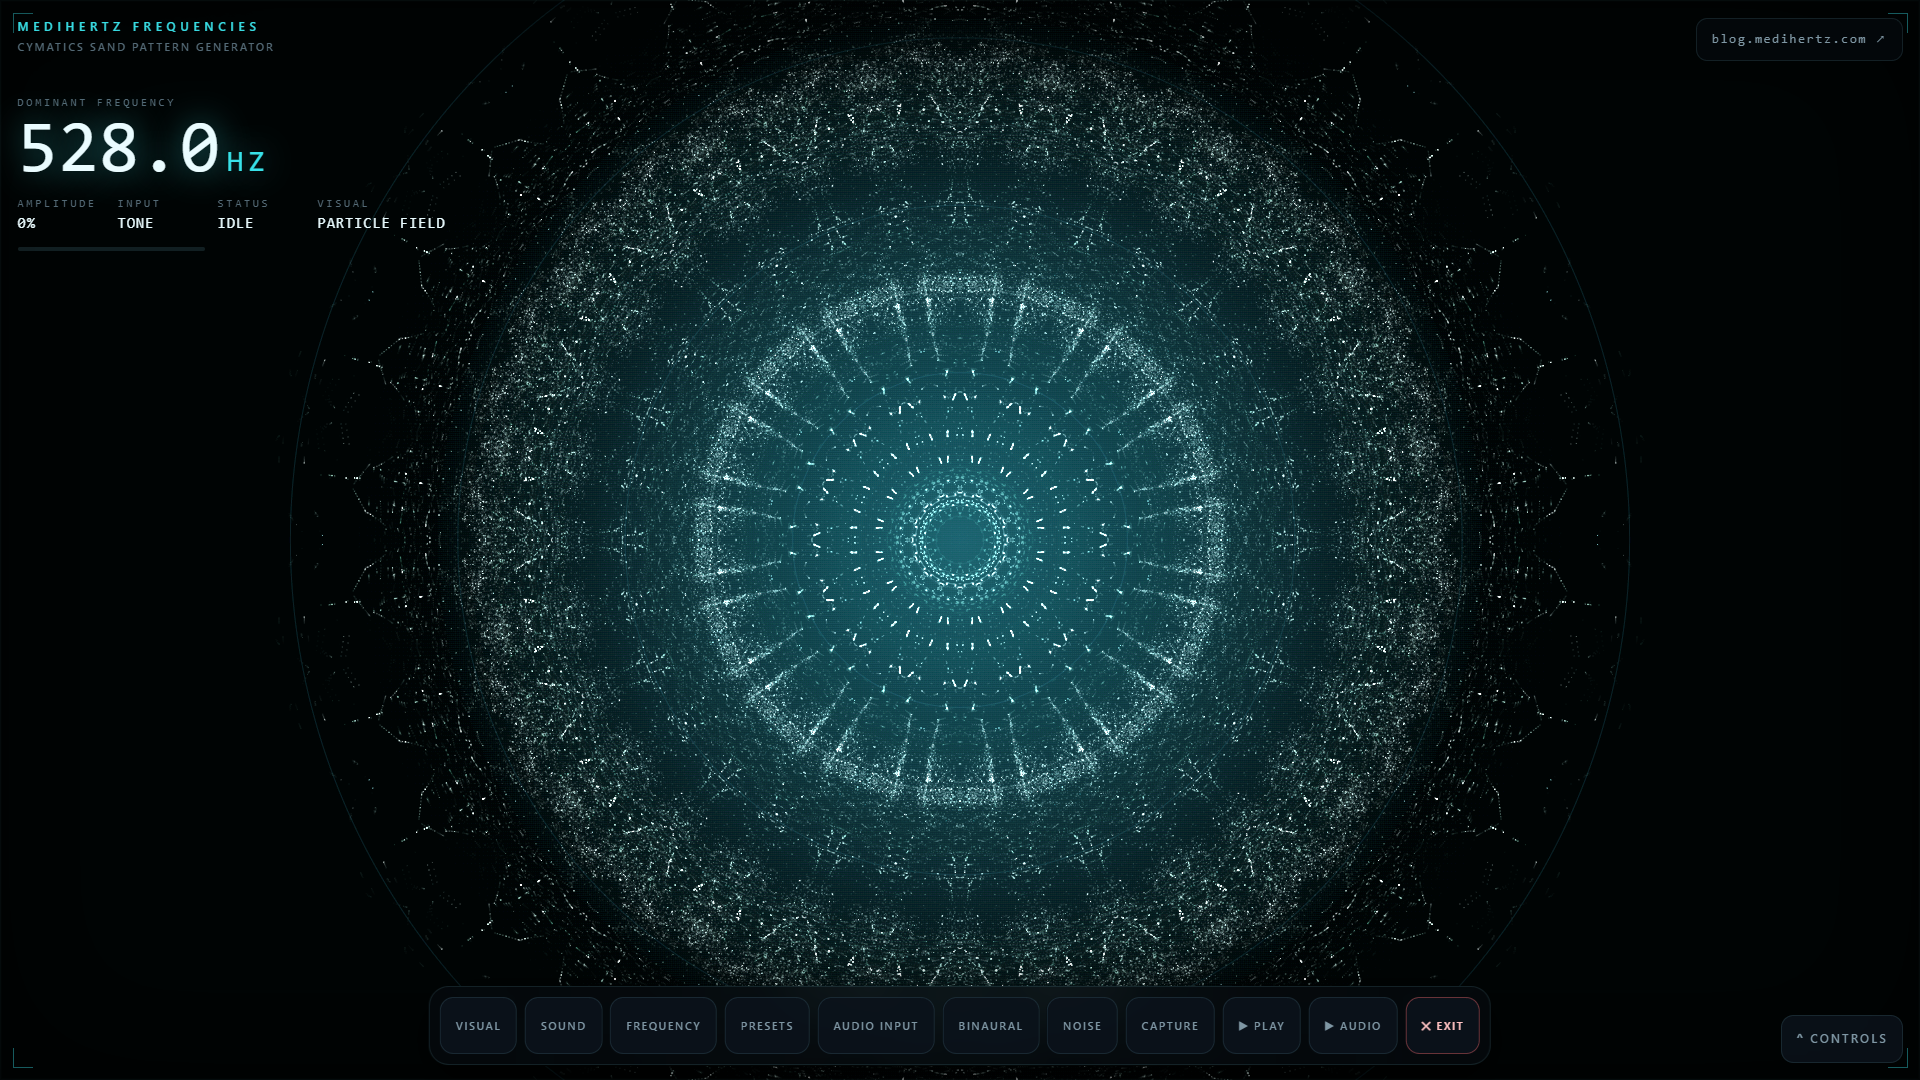
The most interesting part of the new Audio Input mode is that you can become part of the experiment.
Try these simple experiments:
1. Speak
Say your name or read one sentence.
Watch the detected frequency change as you speak.
2. Hum
Hold one comfortable note for several seconds.
Notice whether the displayed frequency becomes more stable.
3. Sing
Sing the same note and then move gradually higher.
Watch the frequency response change.
4. Chant or recite a mantra
Try a familiar chant or mantra and observe its changing audio pattern.
5. Clap
Create a short, sharp sound and watch how the visualization reacts.
6. Play music
Play music near the microphone and observe the more complex frequency activity.
7. Listen to your room
Turn off music and remain quiet for a moment.
Then observe the sound activity captured by the microphone.
This transforms the generator from a simple tone tool into an interactive audio visualization laboratory.
Ernst Chladni- The Father of Cymatics

At the beginning of this science, one name always comes first — Ernst Chladni.
He was a German scientist and musician who first showed the world that sound can be seen, not just heard. In the 18th century, he sprinkled sand on metal plates and used a violin bow to create vibrations. As the frequency changed, the sand started forming beautiful geometric patterns — now known as Chladni patterns.
This simple but powerful experiment became the foundation of what we today call cymatics. It proved that sound frequencies can organize matter into structured designs, helping us understand how vibration shapes the physical world around us.
-
Born: November 30, 1756, Wittenberg, Saxony
-
Died: April 3, 1827, Breslau (now Wrocław, Poland)
-
Known for: Chladni figures; theory of cosmic origin of meteorites
-
Major works: Entdeckungen über die Theorie des Klanges (1787); Die Akustik (1802); Über Feuer-Meteore (1819)
-
Honors: Awarded 6,000 francs by Napoleon Bonaparte for acoustical discoveries
Chladni’s experiments are an important historical example of making sound-related vibration visible. Today’s digital visualizers cannot reproduce every detail of a physical Chladni plate, but they can provide an accessible way to explore the relationship between sound, frequency, vibration and visual pattern.
🎧 How Sound Interacts With Matter
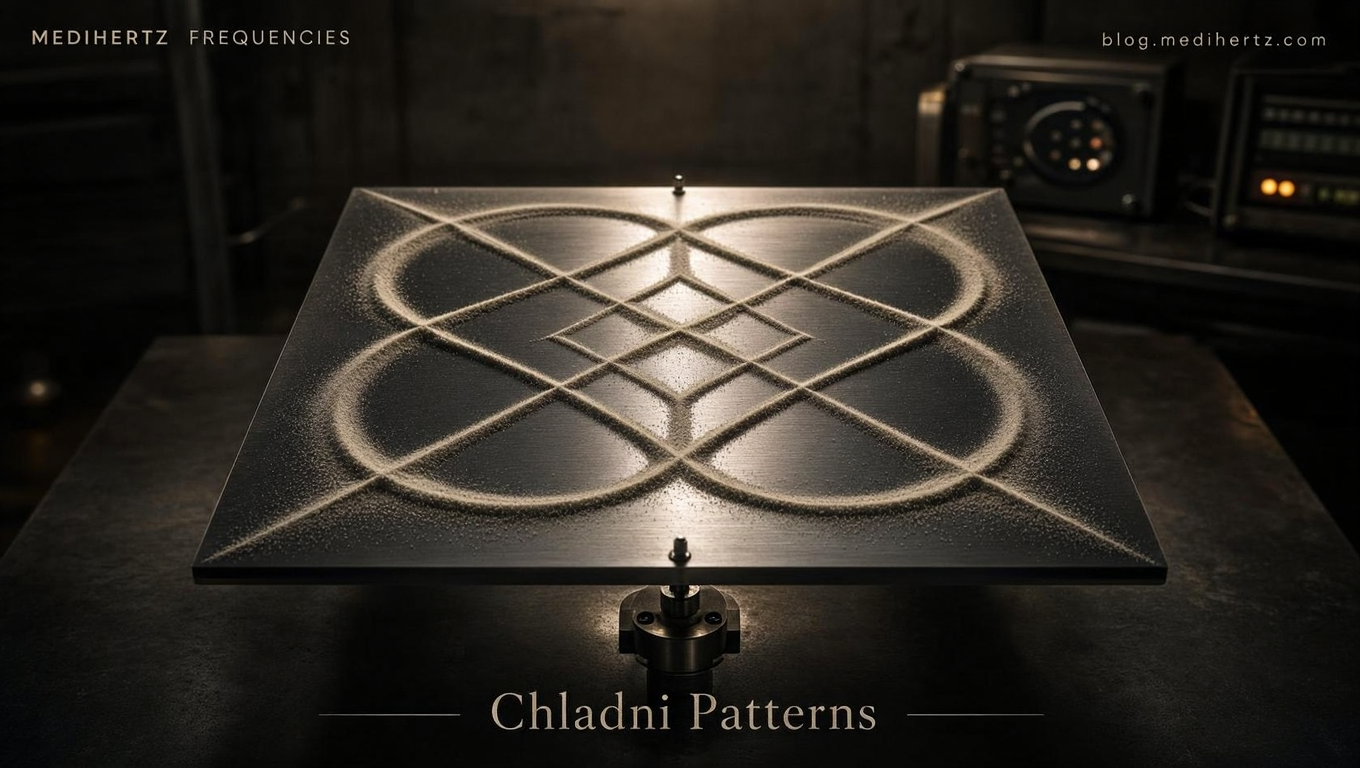
When a vibrating system is driven by sound, its response depends on factors such as frequency, amplitude, material properties, geometry and resonance.
In physical cymatics experiments:
- Solid surfaces can produce visible geometric patterns.
- Liquid surfaces can produce ripples and wave structures.
- Air carries sound waves and can participate in acoustic resonance.
This is why sand, water and other materials are often used in demonstrations of vibration and resonance.
A simple way to understand the idea is:
Change the sound → change the vibration → potentially change the visible response.
The digital visualizer provides an interactive representation of this idea.
🔬 Explore Popular Frequencies With Visual Patterns
Now let’s explore several frequencies that are commonly discussed in meditation, sound and frequency communities.
You can enter these values into the generator and observe how the digital visualization changes.
The visual pattern is generated by the tool and should not be interpreted as proof that a particular frequency produces a specific medical or psychological effect.
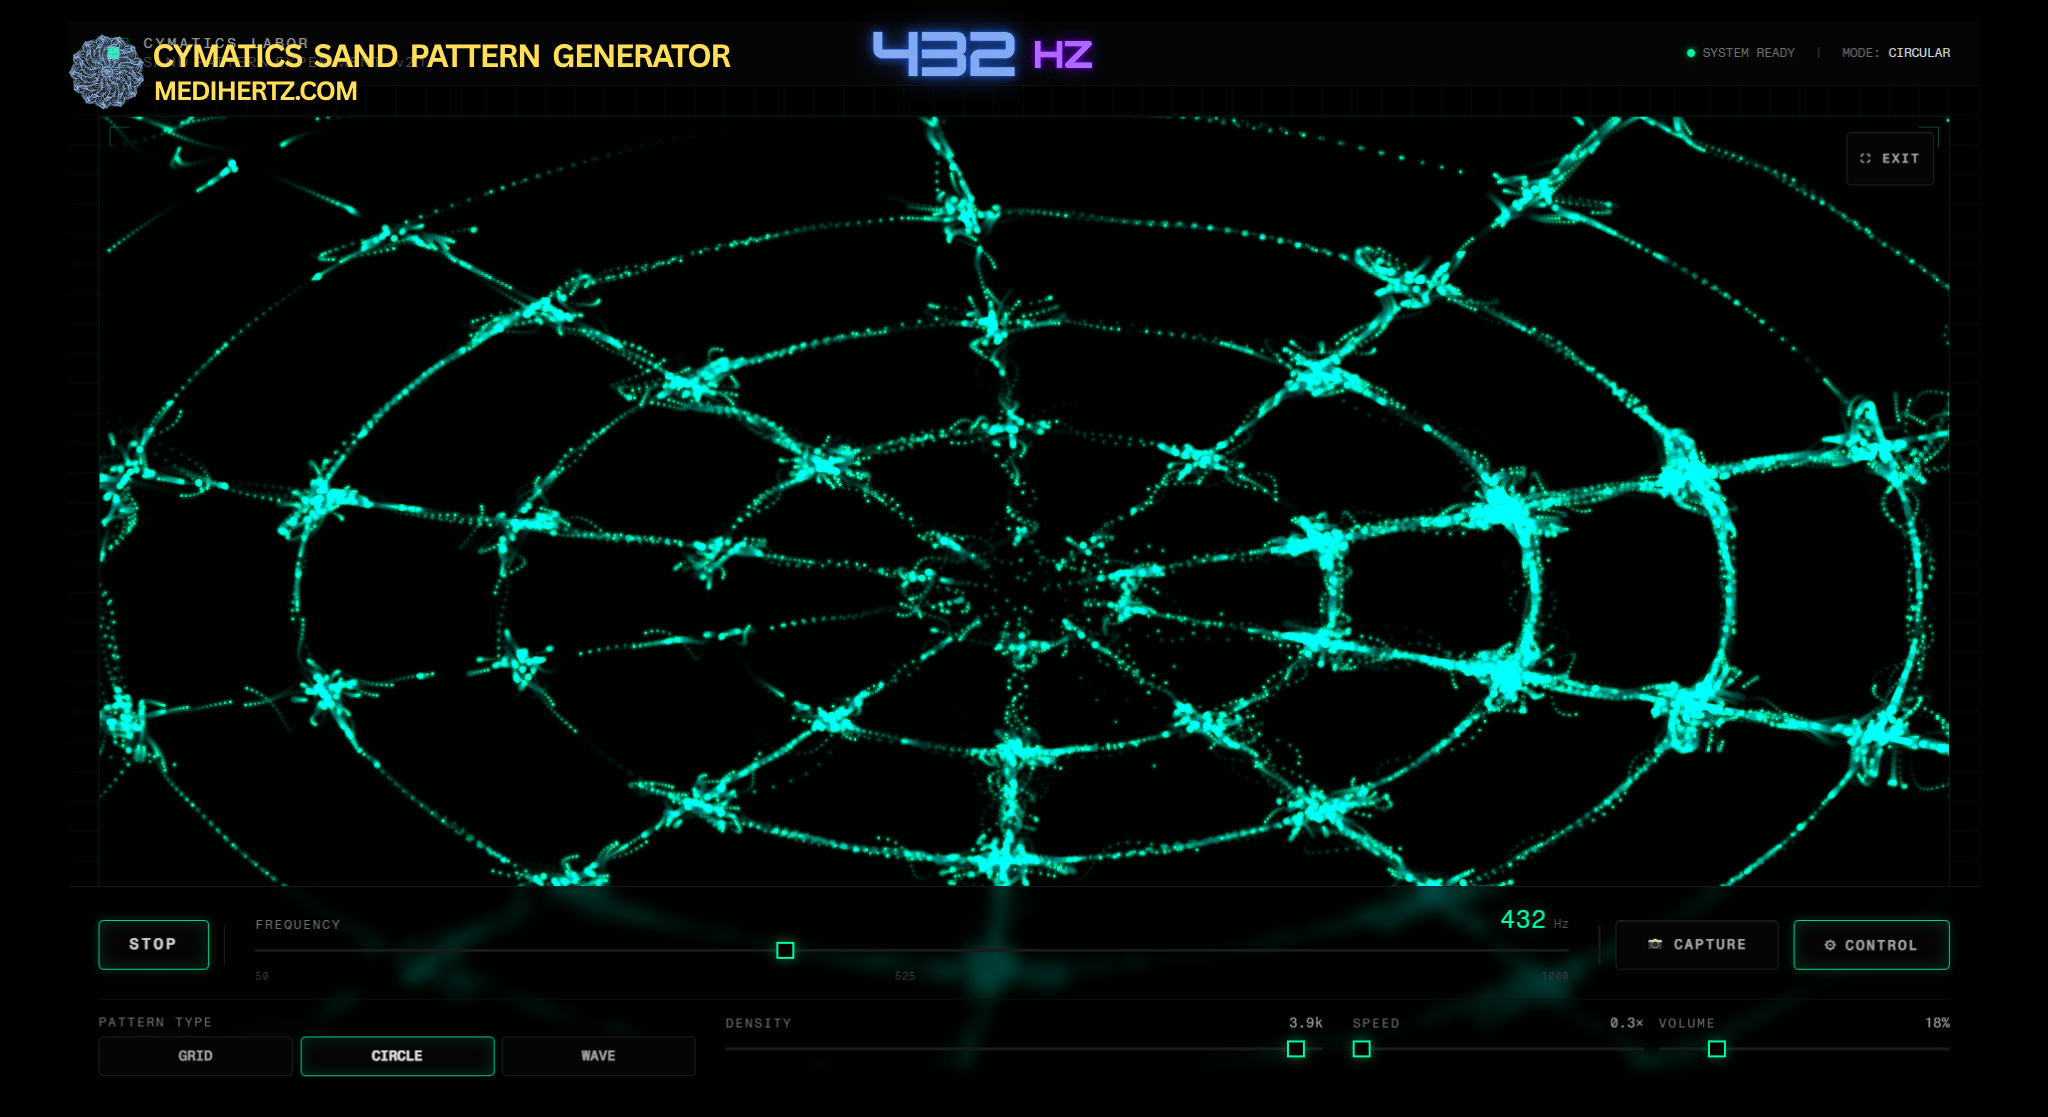
🔵 432 Hz — A Popular Tuning & Meditation Frequency
432 Hz is widely discussed as an alternative tuning reference to the commonly used 440 Hz standard.
You can use the generator to compare 432 Hz and 440 Hz and observe how the digital visual representation changes.
Try both frequencies and look at:
- Pattern symmetry
- Density
- Movement
- Visual complexity
- Frequency response
Many listeners also use 432 Hz music for relaxation or meditation, although personal listening experiences vary.
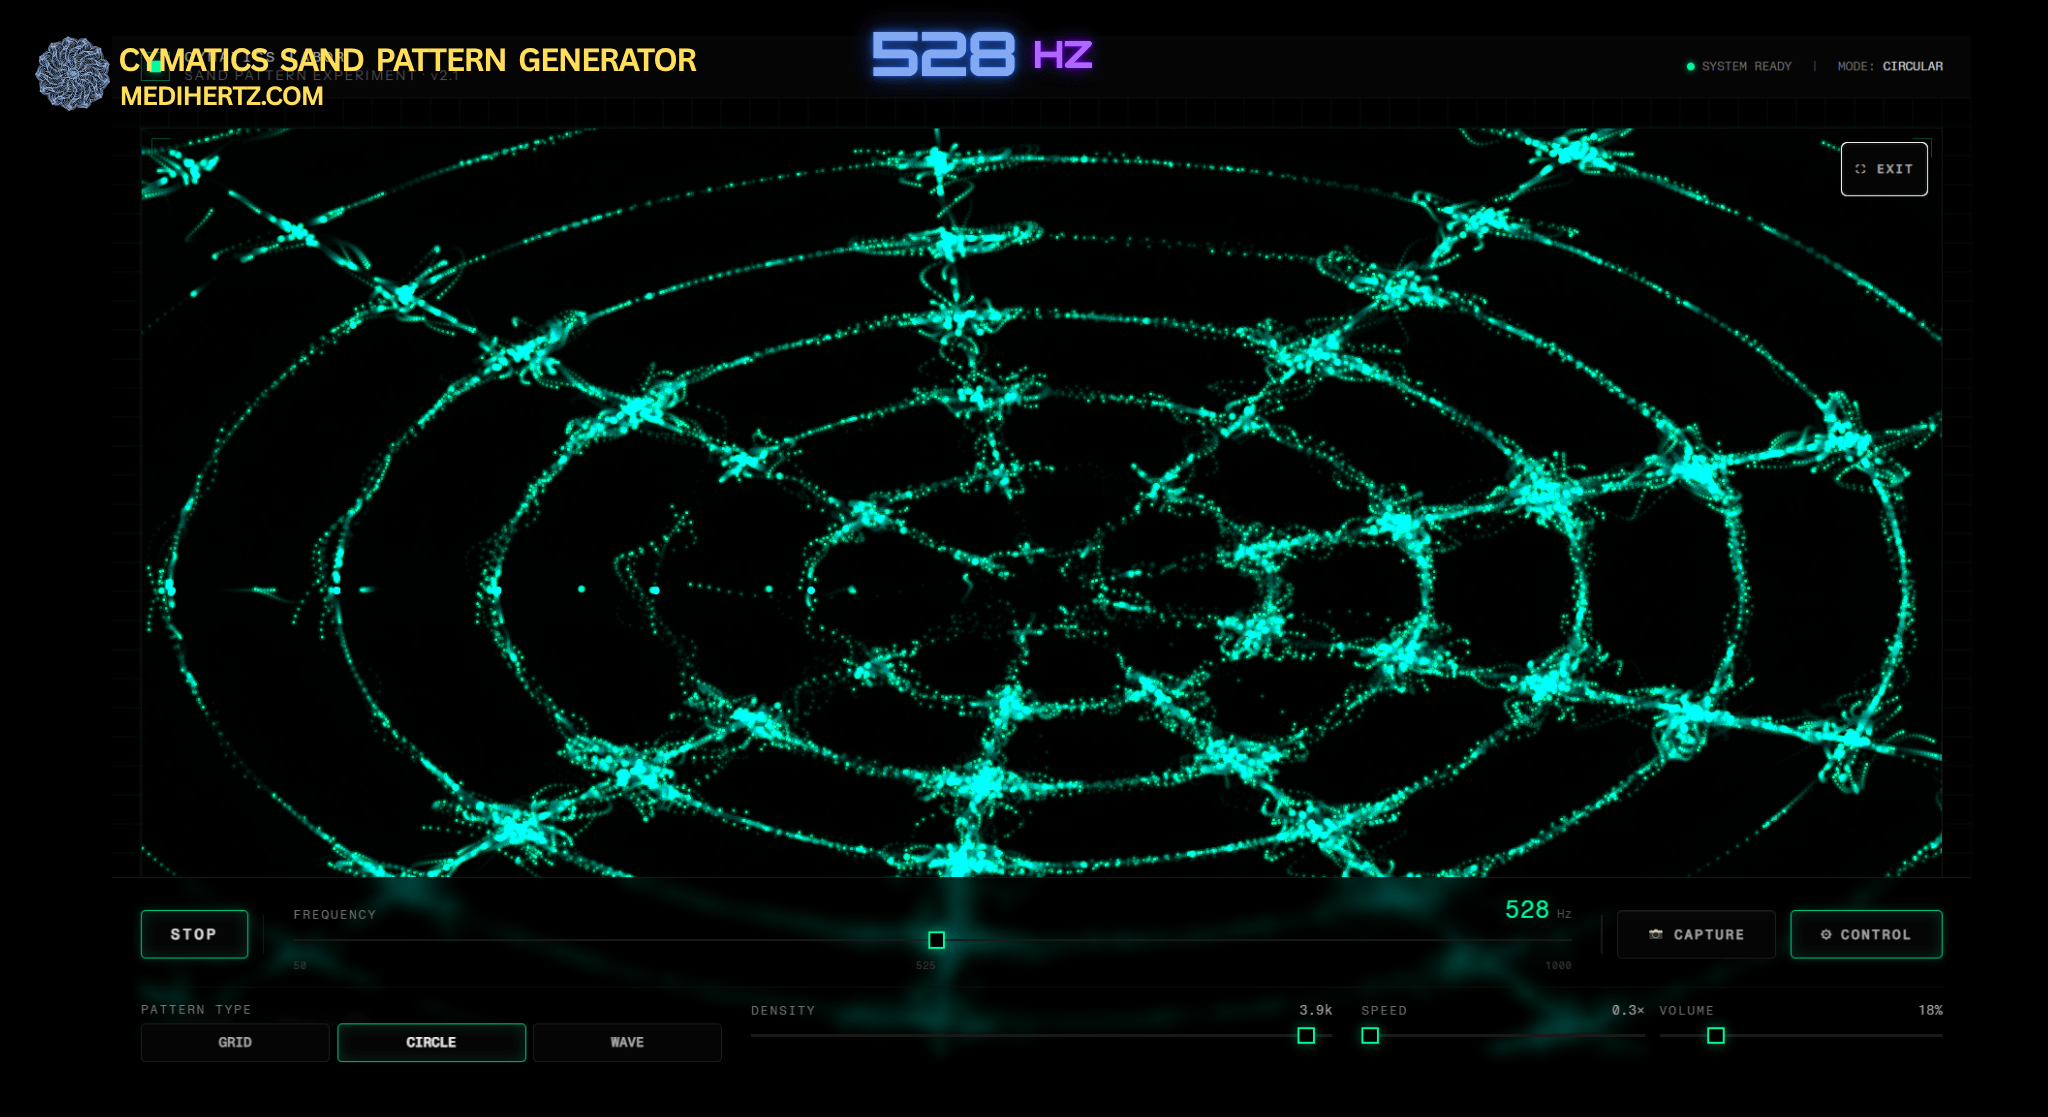
🟢 528 Hz — A Popular Solfeggio Frequency
528 Hz is one of the best-known frequencies in modern Solfeggio-frequency discussions and is often called the “love frequency.”
You can generate 528 Hz and observe its digital cymatic visualization.
Claims about emotional transformation, healing or biological effects should be understood as traditional, spiritual or wellness claims rather than established medical facts.
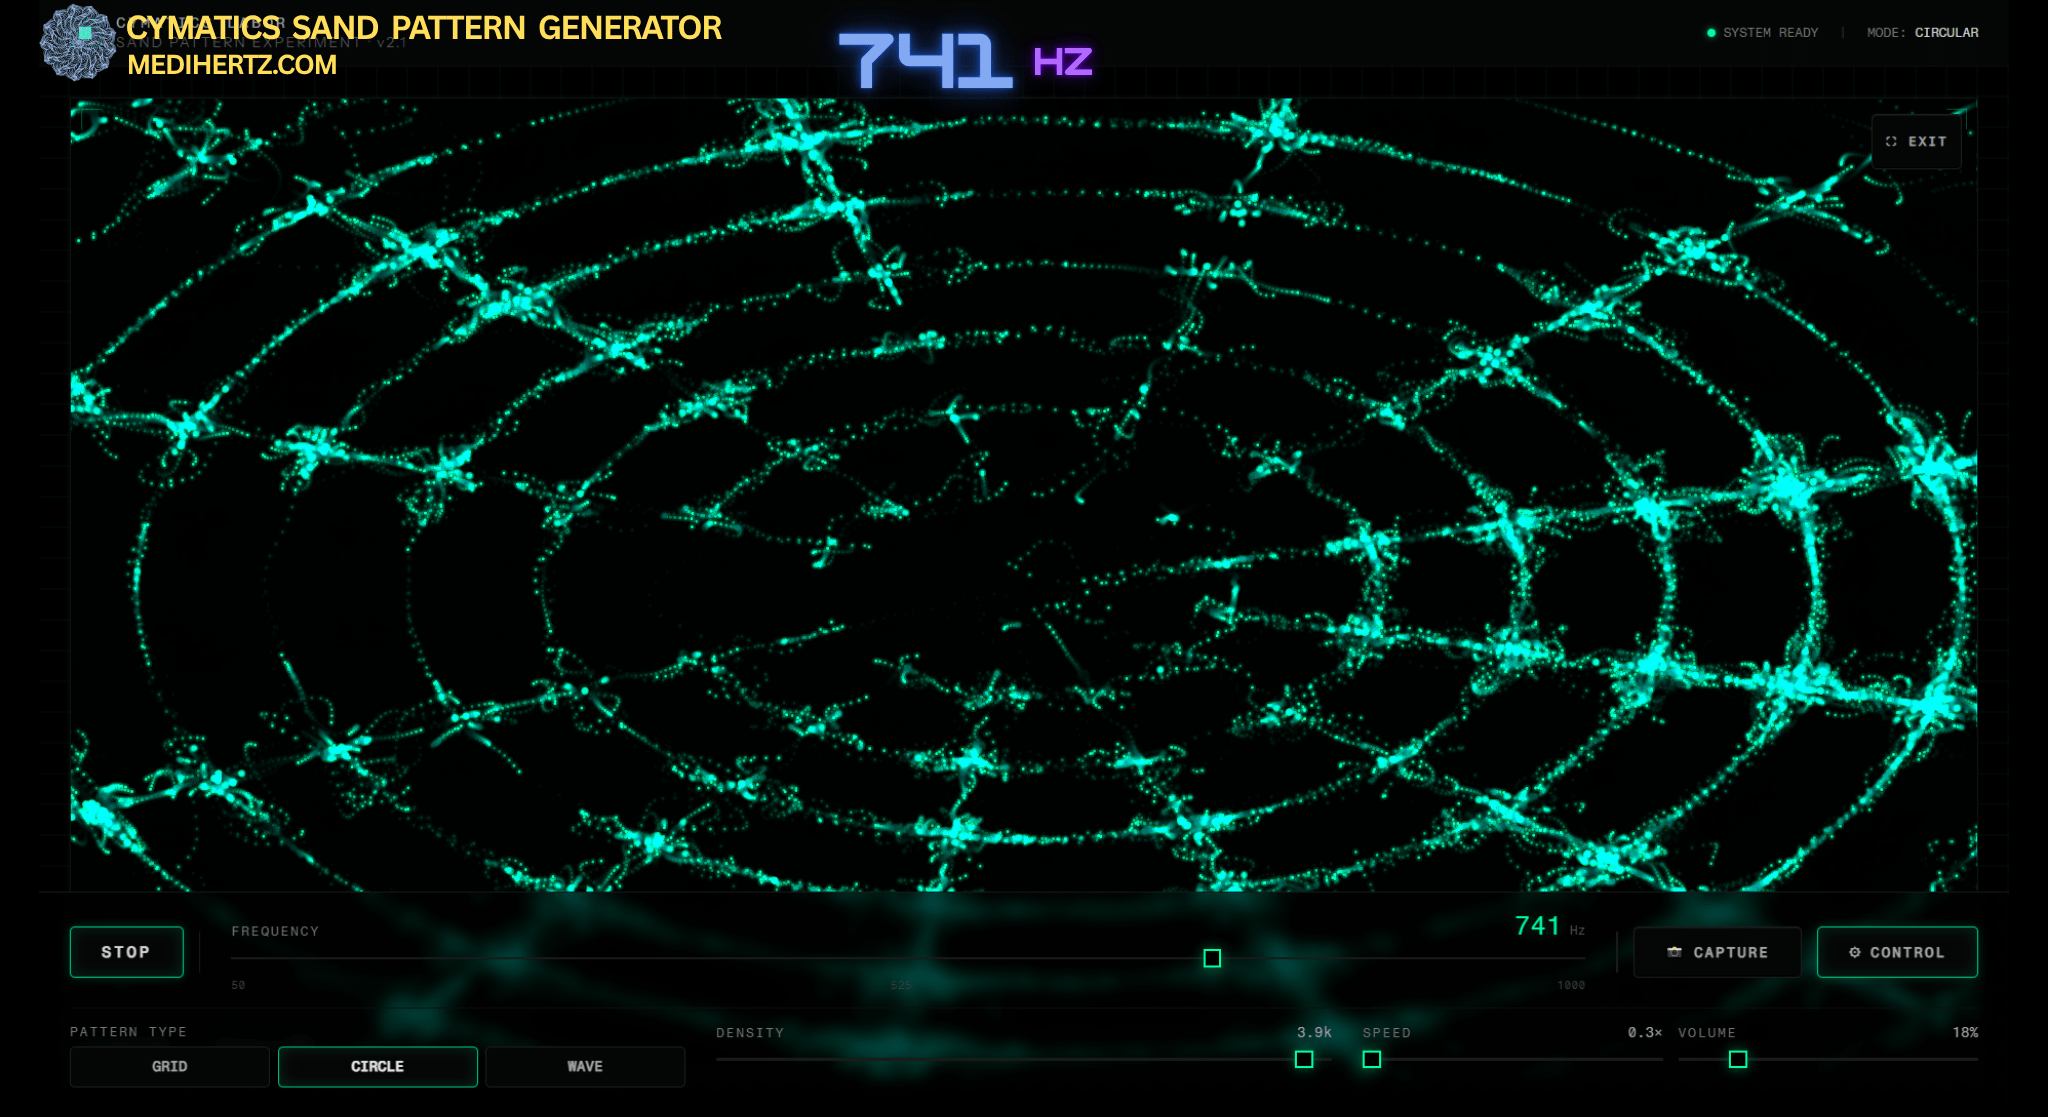
🟡 741 Hz — A Popular Solfeggio Frequency
741 Hz is another frequency commonly used in meditation and frequency-based audio.
Try generating 741 Hz and compare its visual response with 432 Hz or 528 Hz.
This provides a simple way to explore how changing frequency values can produce different digital visual patterns.
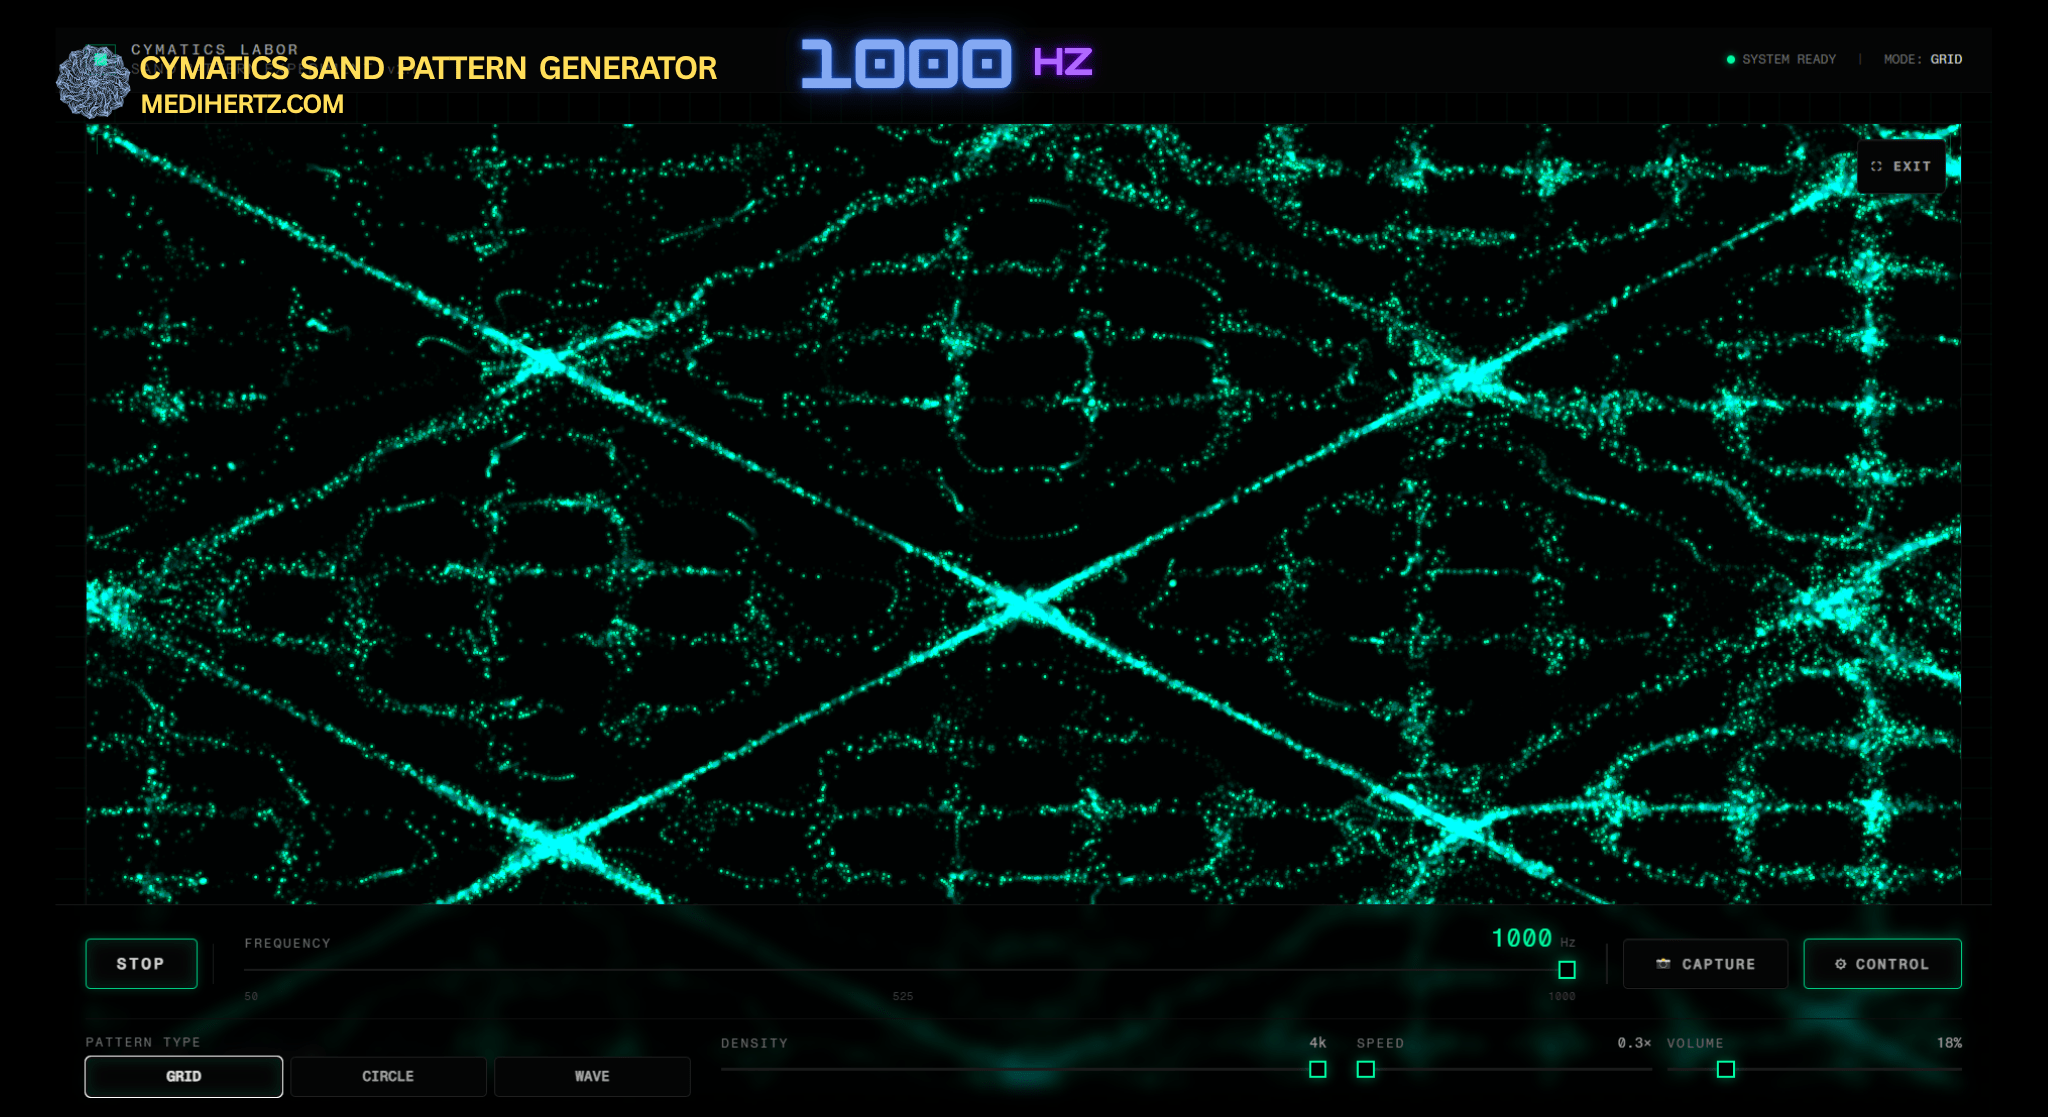
🔴 1000+ Hz — Explore Higher Audio Frequencies
Try frequencies above 1,000 Hz and observe how the visualization changes.
As you move through different frequencies, the generated pattern may become visually different depending on the visualization algorithm being used.
This is an excellent way to experiment with:
frequency → vibration → visual representation
without assuming that higher frequency automatically means “higher energy” or a particular mental state.
🧠 What Does Your Sound Actually Look Like?
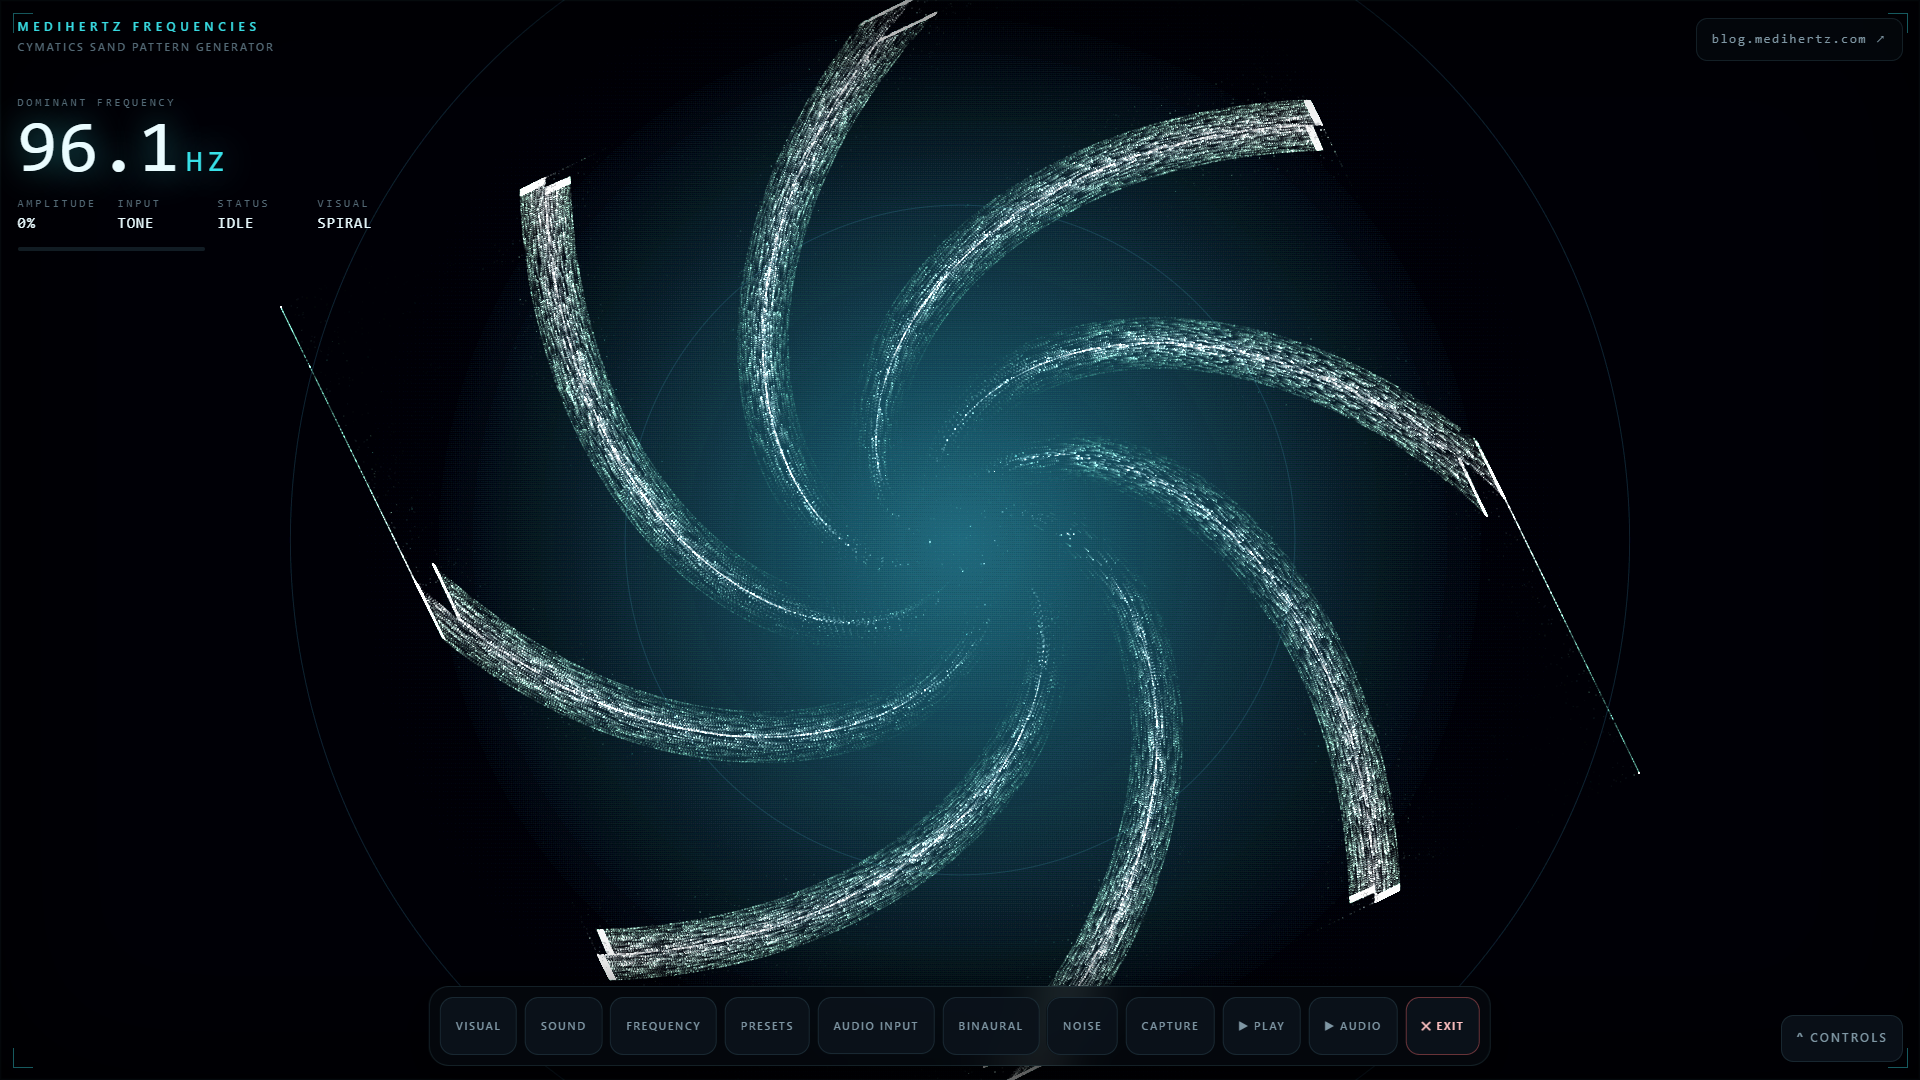
The new Audio Input mode changes the experience from simply selecting a frequency to exploring real sound.
Your voice, music, chanting and environment are constantly changing.
Instead of asking only:
“What does 432 Hz look like?”
you can now ask:
“What does my voice look like?”
“What does this mantra look like?”
“What does this bell sound look like?”
“What frequencies are present in my room?”
“How does my voice change when I sing higher?”
These experiments turn frequency from an abstract number into something you can hear, observe and explore.
⚡ Explore Frequency Instantly
You don’t need laboratory equipment to begin exploring sound.
Inside the tool you can:
- Generate a specific frequency
- Adjust frequency manually
- Listen to the tone
- Use your microphone
- Analyze your voice
- Play or capture external sounds
- Experiment with mantras and chants
- Explore white, pink and brown noise
- Experiment with binaural beats
- Change visual modes
- Compare different frequency patterns
- Capture interesting visual results
The experience is simple:
Choose a sound → listen → observe → change the sound → compare.
🧠 Frequencies for Mind, Body & Self Awakening
🌿 Frequencies Commonly Explored for Mind, Meditation & Listening
Different frequencies are associated with different traditions, listening practices and wellness communities.
The table below should be understood as a cultural and experiential reference, not a medical prescription.
Then keep your existing table.
This lets you retain the Solfeggio content while making the article more responsible.
| Frequency | Effect on You | Use Case |
|---|---|---|
| 174 Hz | Deep relaxation | Stress relief |
| 285 Hz | Body repair feeling | Healing meditation |
| 396 Hz | Releases fear | Emotional detox |
| 417 Hz | Removes negativity | Energy reset |
| 432 Hz | Natural calmness | Daily listening |
| 528 Hz | Love & transformation | Inner healing |
| 639 Hz | Emotional bonding | Relationships |
| 741 Hz | Mental clarity | Focus & decision making |
| 852 Hz | Intuition boost | Awareness |
| 963 Hz | Spiritual awakening | Deep meditation |
🧪 DIY Cymatics Experiments You Can Try
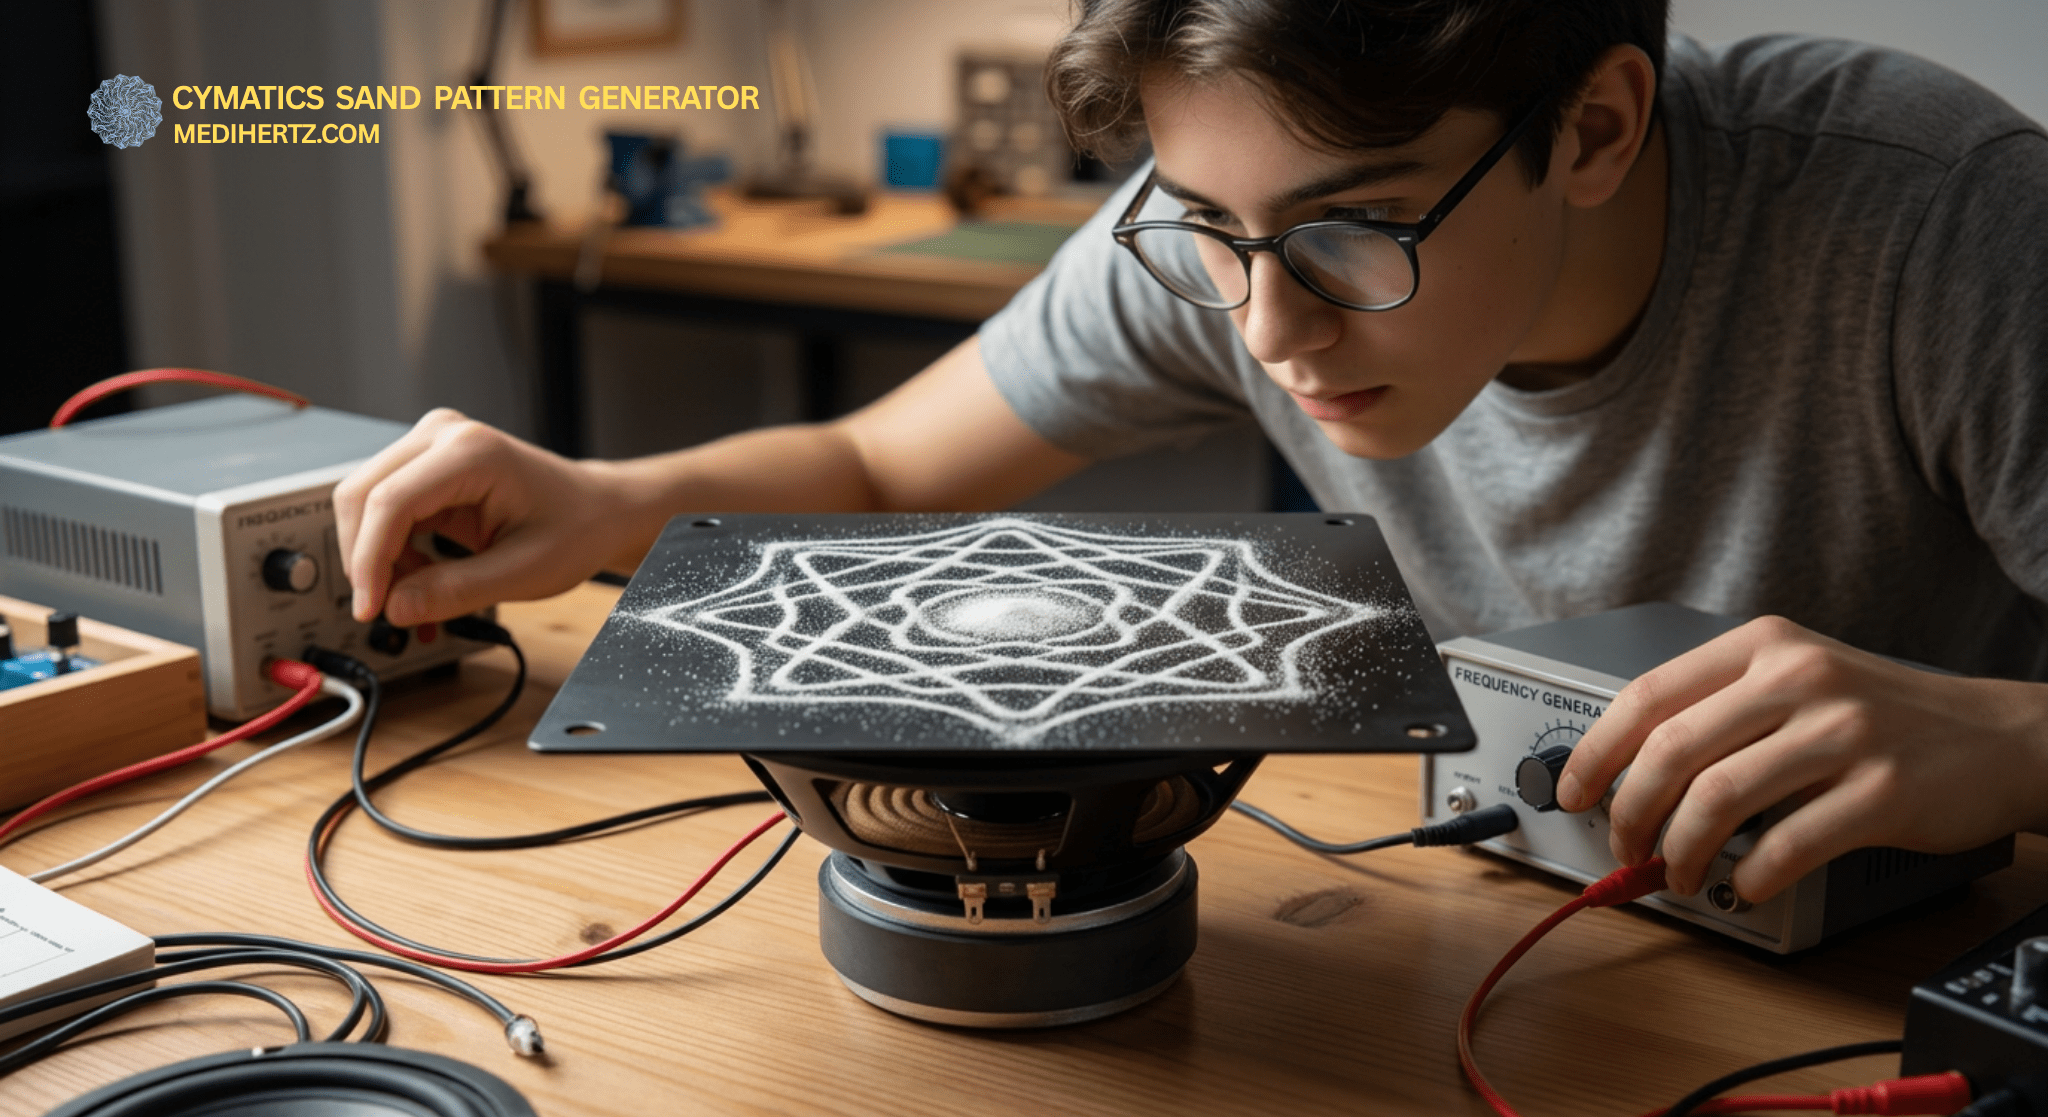
You can now begin with a digital experiment before trying a physical setup. Use the generator to explore a frequency, then compare the idea with a real sand, water or Chladni-plate experiment.
- Cymatics experiment at home with sand
- Sound frequency water experiment using a speaker
- Cymatics bubble experiment
- DIY cymatics experiment with metal plate (Chladni patterns)
All of these are part of real sound frequency experiments used in physics and research.
🎓 Cymatics Experiment for School Students
If you are a student or teacher, cymatics is one of the most exciting and easy science experiments you can try.
Digital preparation: Students can first use the Audio Input or Tone Generator modes to explore frequency visually before attempting a physical cymatics experiment.
You don’t need complex equipment to understand how sound works.
👉 Simple experiment idea:
Take a metal plate or a thin tray
Sprinkle some sand or salt on it
Connect it to a speaker or vibration source
Play different sound frequencies
Now observe closely…
As the frequency changes, the sand will move and form different patterns. This shows how sound vibrations affect matter.
👉 What you learn from this:
How frequency changes patterns
How vibration moves particles
Basic physics of sound waves
Real-life example of cymatics science
This makes cymatics a perfect project for:
✔ School science fairs
✔ Physics experiments
✔ Fun learning at home
It’s one of the easiest ways to actually “see sound”.
🕉️ Explore Voices, Mantras, Chants & Everyday Sounds
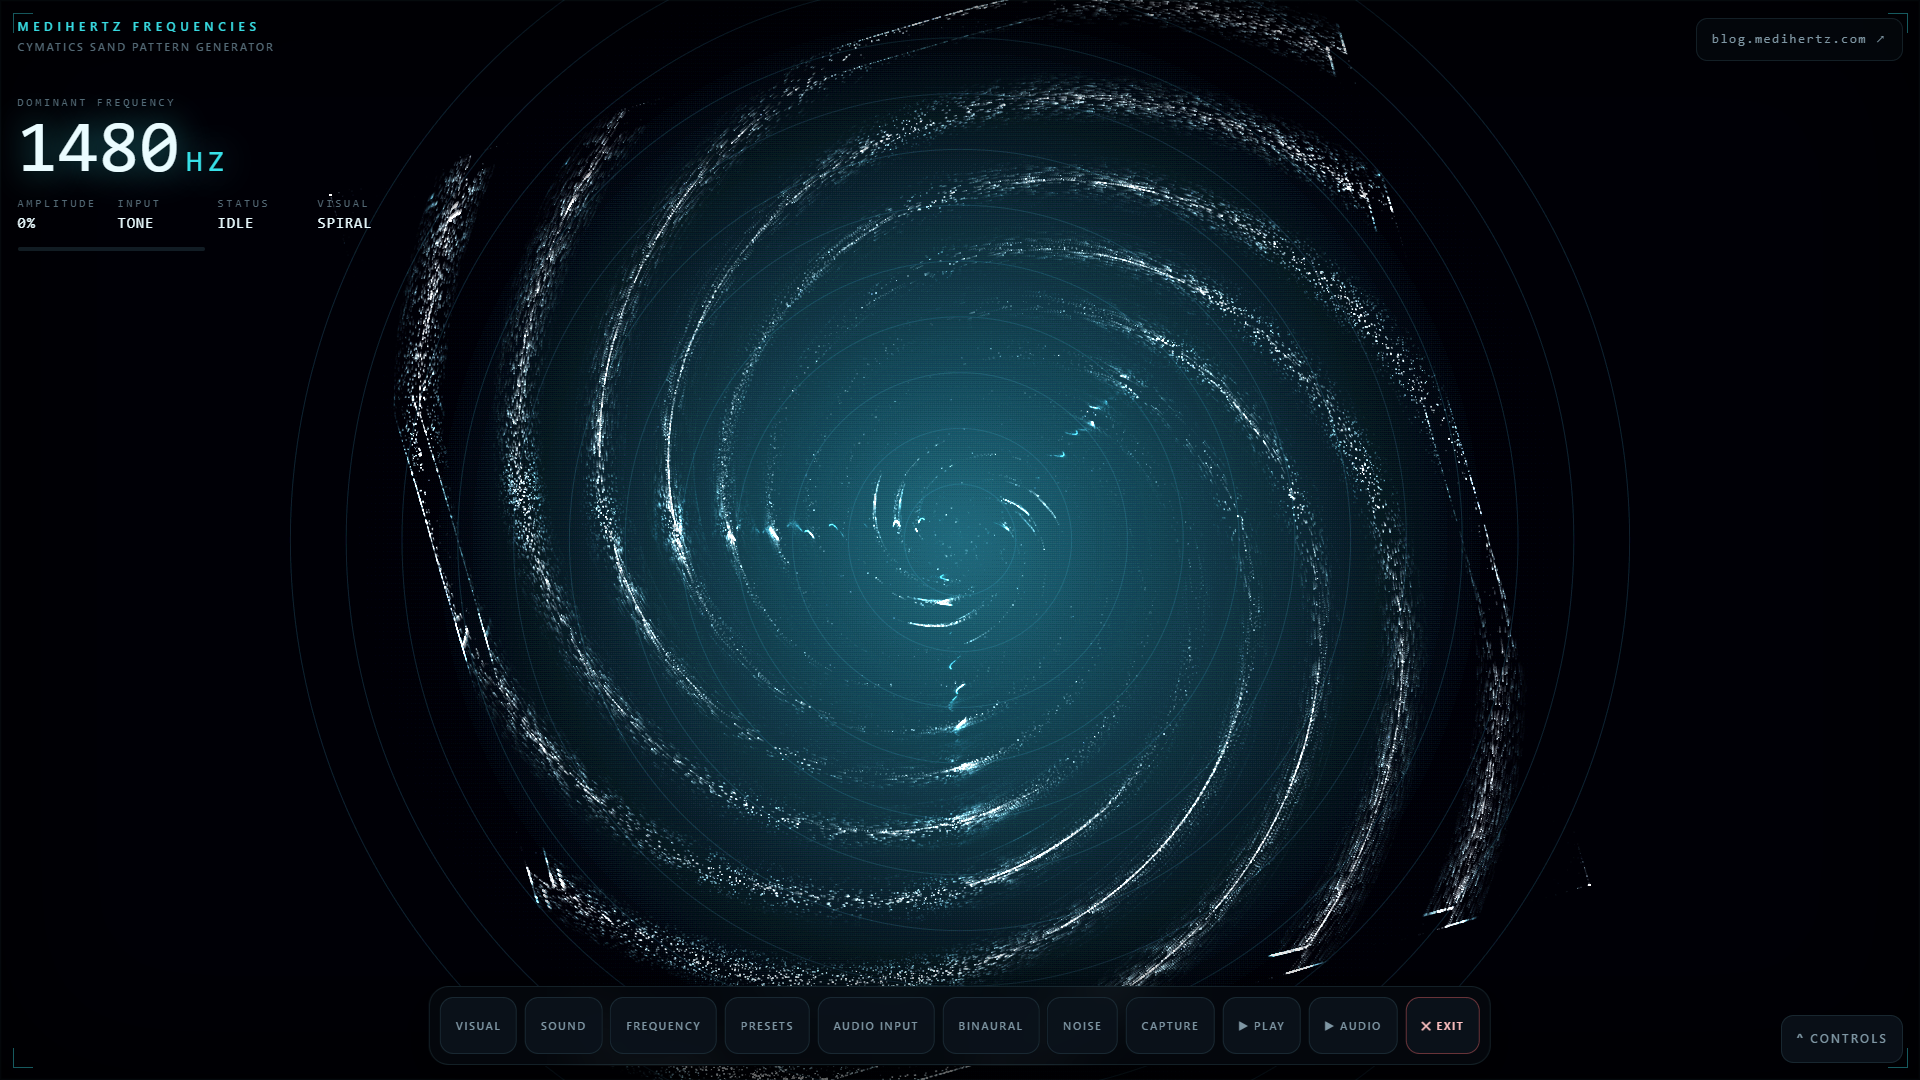
Sound does not only come from electronic tone generators.
People have explored sound through speech, music, chanting and instruments for thousands of years.
With Audio Input, you can experiment with sounds such as:
- Mantras
- Om chanting
- Meditation chants
- Temple bells
- Conch sounds
- Singing bowls
- Musical instruments
- Prayer or devotional chanting
- Spoken words
- Singing
- Nature sounds
- Rain
- Flowing water
- Room ambience
- Street noise
- Household sounds
You can observe how different sounds produce different frequency distributions and visual responses.
Temple and devotional sounds
A bell, chant or conch does not contain only one frequency.
It can contain a fundamental tone together with harmonics and changing resonances.
That complexity is exactly what makes real-world sound interesting to visualize.
🔉 Comfortable, Neutral & Potentially Disruptive Sound Environments
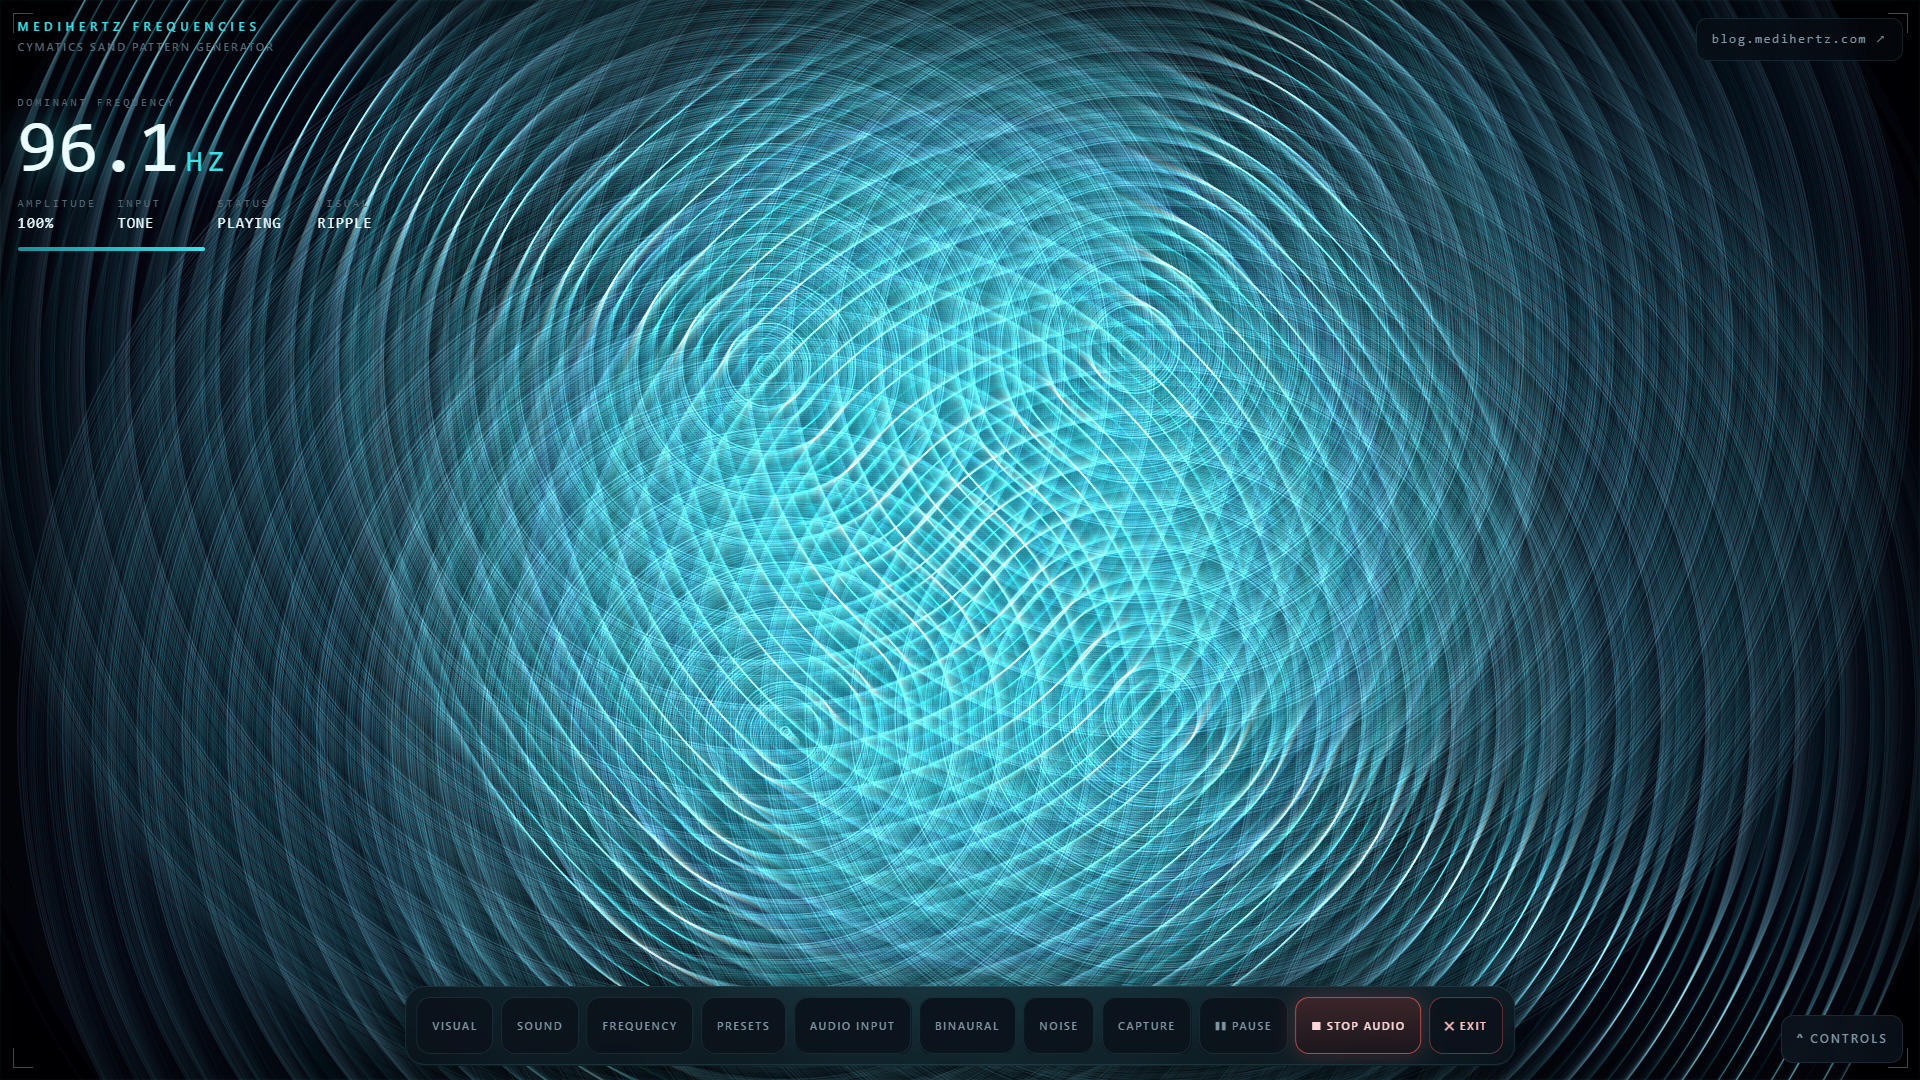
People often search for “good vibrations” or “unhealthy vibrations.”
However, a sound should not be classified as healthy or unhealthy simply because it contains a particular frequency.
Loudness, duration, exposure, context and individual sensitivity all matter.
Comfortable or calming sound environments
Examples may include:
- Gentle rainfall
- Soft flowing water
- Quiet nature sounds
- Low-level ambient sound
- Gentle music
- Soft chanting
- Controlled meditation audio
Neutral everyday sound environments
Examples include:
- Normal conversation
- Computer fans
- Household ambience
- Background music
- Ordinary room noise
Potentially disruptive sound environments
Examples include:
- Very loud music
- Sudden sharp sounds
- Persistent traffic noise
- Construction noise
- Alarms
- Loud machinery
- Prolonged high-volume sound
The Audio Input visualizer can help you observe the frequency content of these sounds, but it does not diagnose whether a sound is medically safe or unsafe.
🧠 Sound, Humans, Mind & Animals
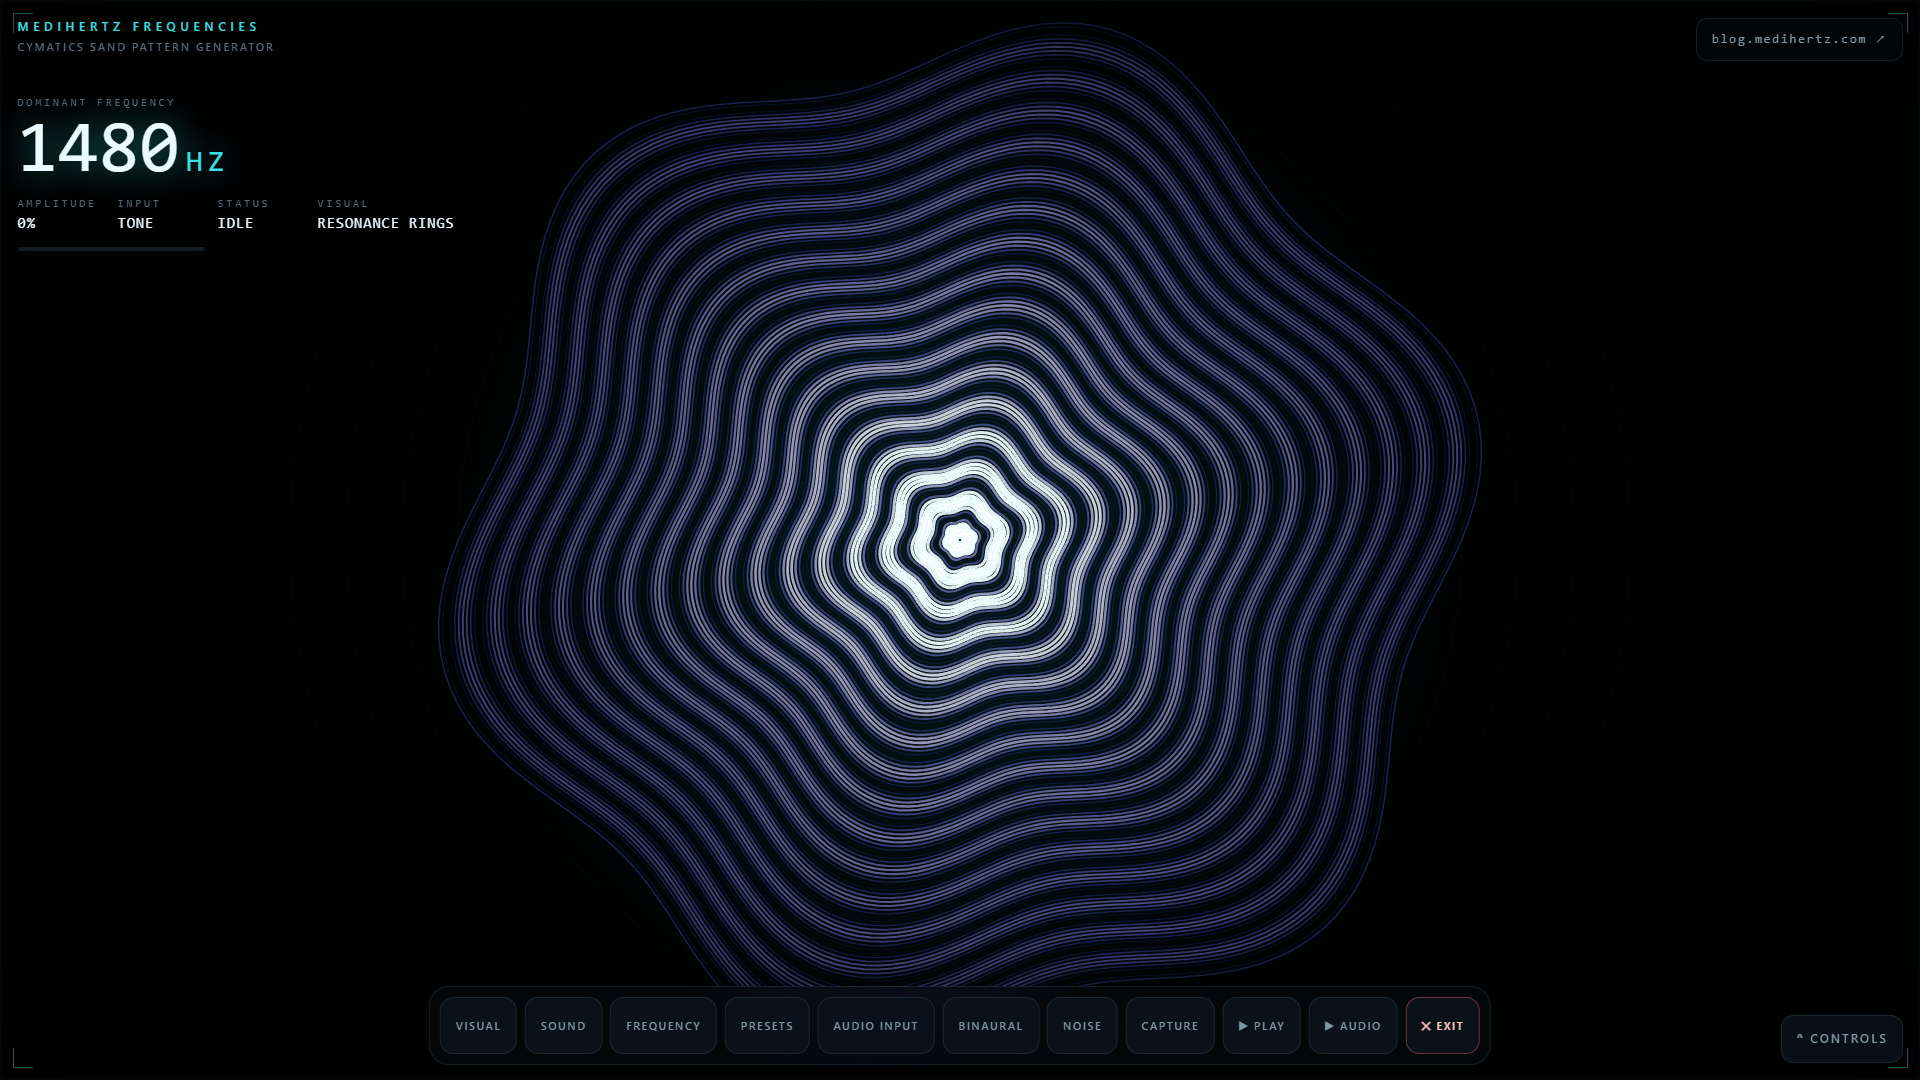
Different listeners experience sound differently.
Humans
Human hearing covers a broad range of audible frequencies, although sensitivity varies between individuals and generally changes with age.
The tool can help you explore the frequencies contained within speech, music and environmental sounds.
Mind and listening experience
Different sound environments can influence how people experience relaxation, concentration, stimulation or distraction.
Rather than assuming that one frequency produces the same response in everyone, use the tool to compare different sounds and observe your own listening experience.
Try:
- Quiet ambience
- Nature sounds
- Pink noise
- Brown noise
- Music
- Chanting
- Steady tones
- Spoken voice
Animals
Animals do not hear exactly the same range of frequencies as humans.
Dogs, cats, birds, rodents, bats and other animals have different hearing capabilities.
A frequency that humans cannot hear may still be detectable by another species.
Do not deliberately expose animals to loud or unfamiliar sounds as an experiment.
The purpose of this section is educational: to understand that sound perception depends on the listener.
🔬 Cymatics Frequency Reference Table — 20 Frequencies to Explore
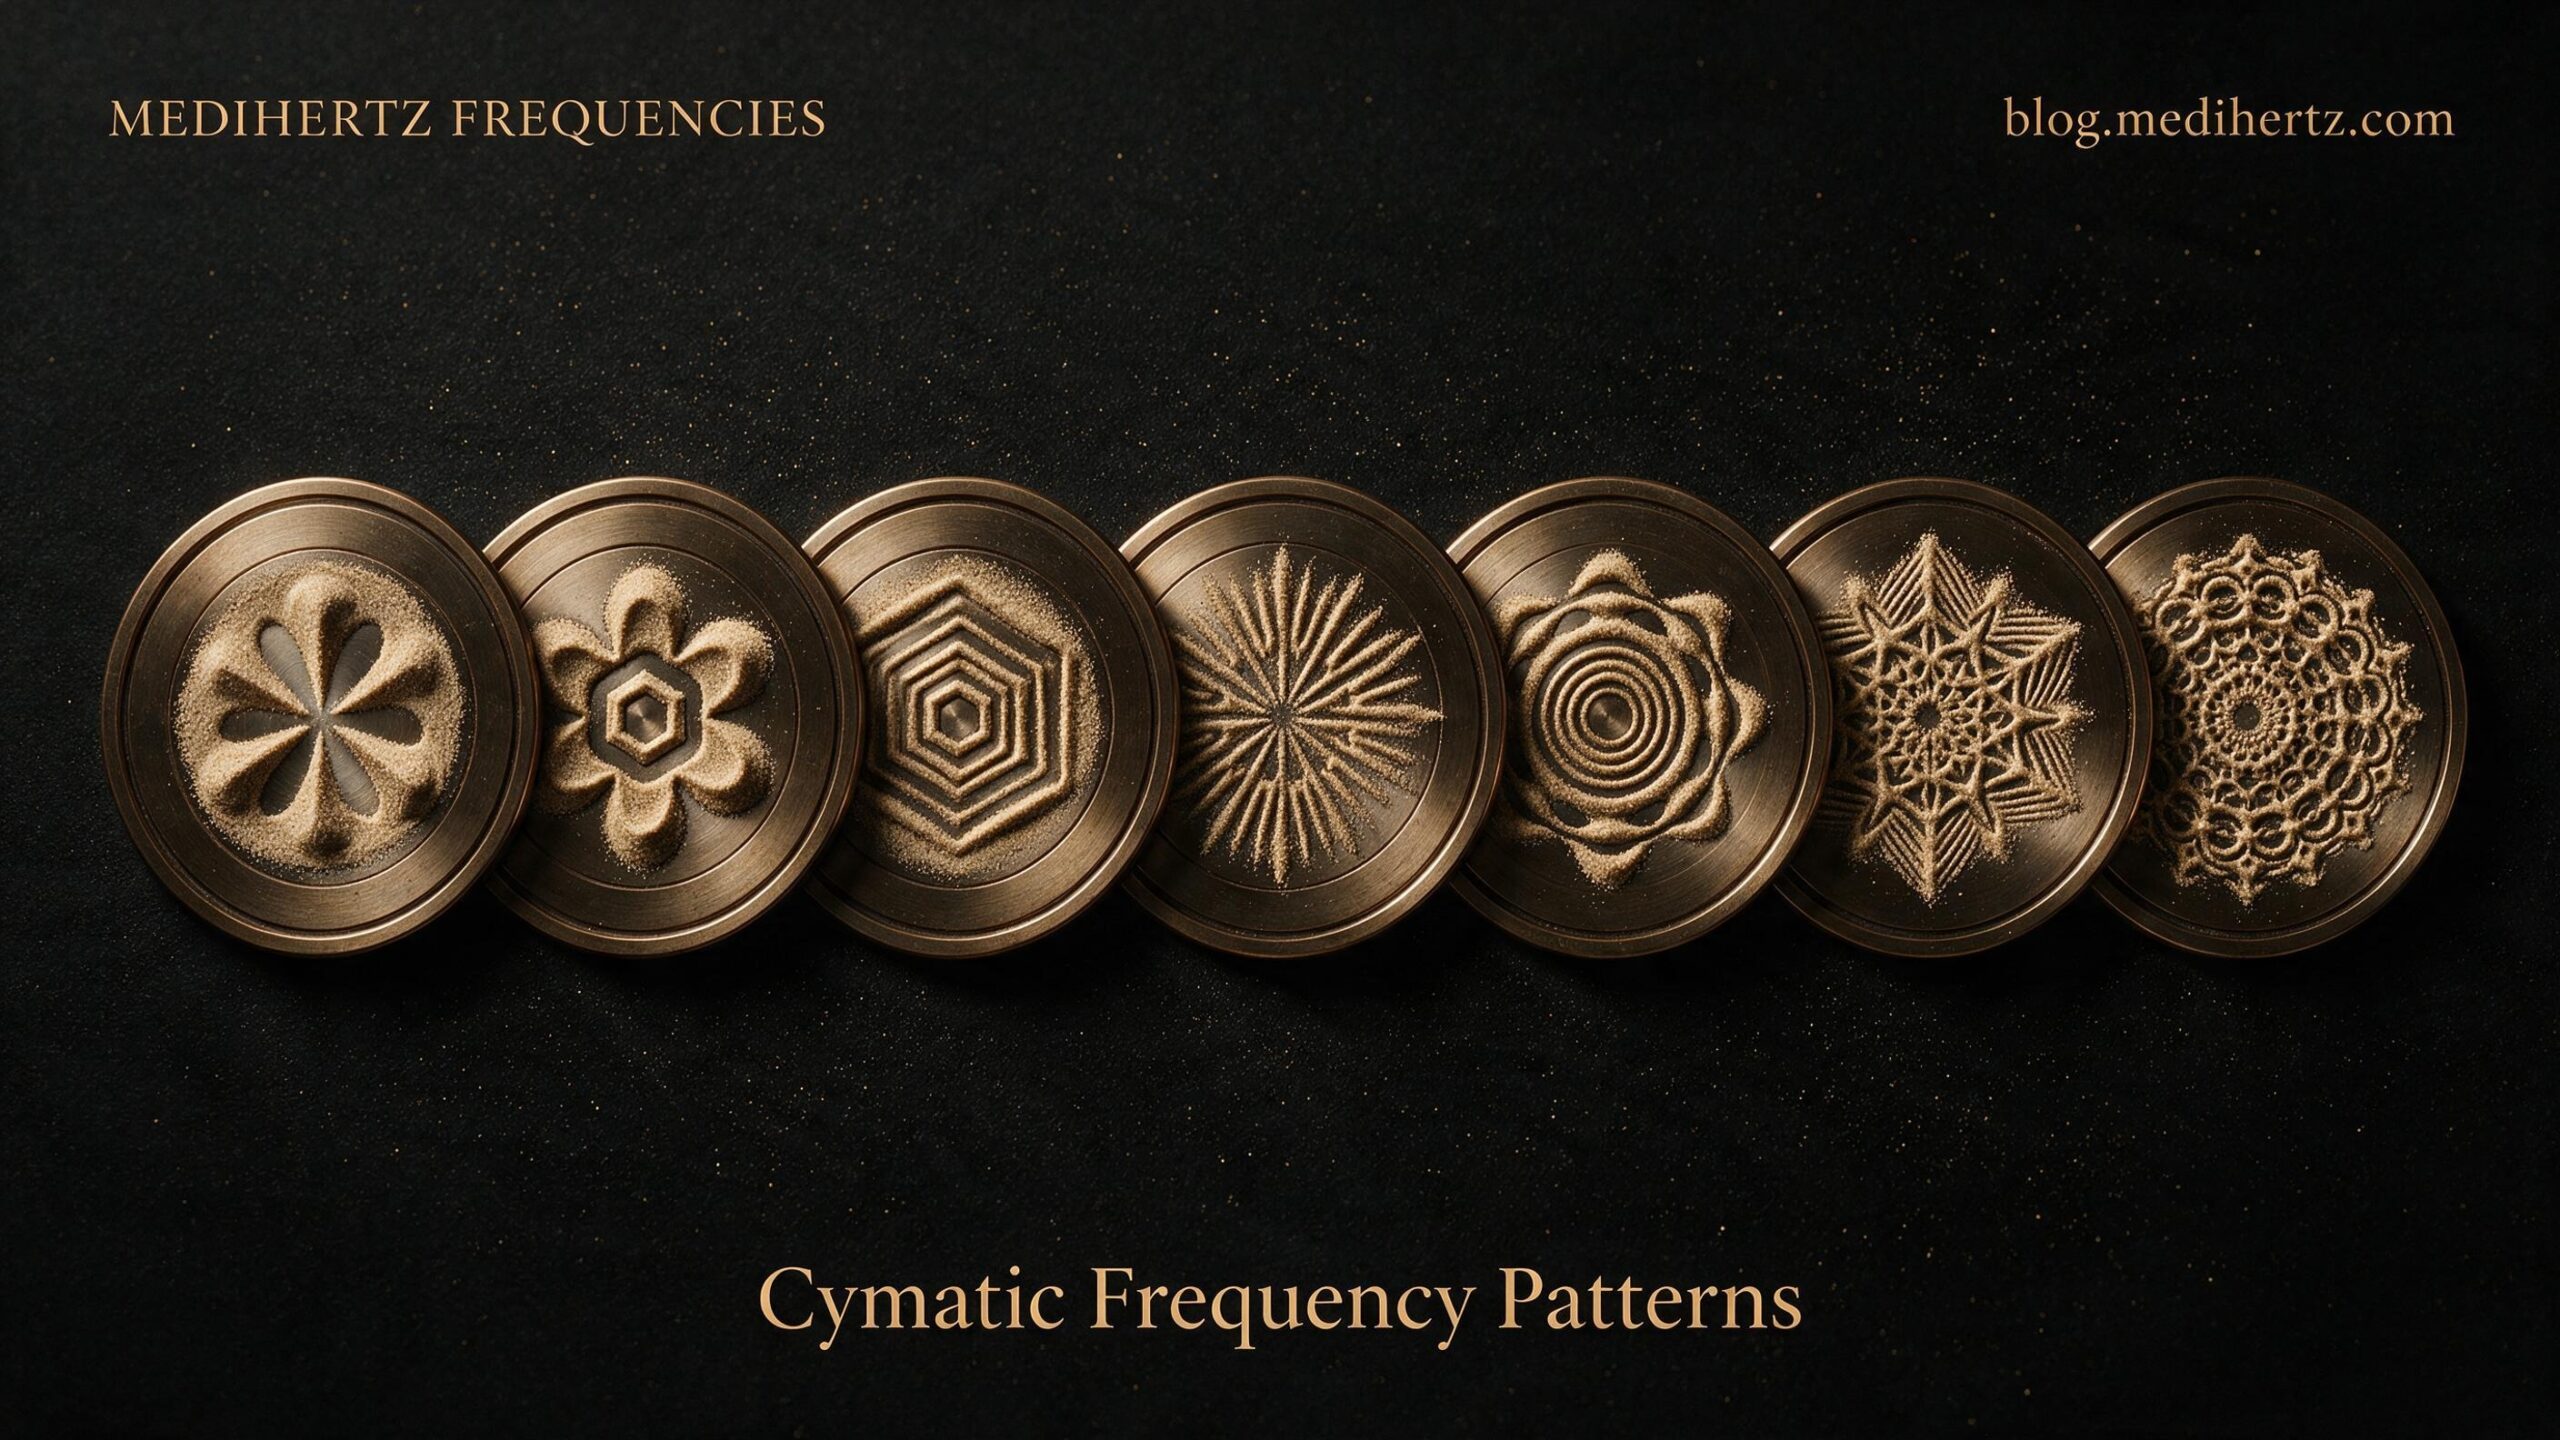
These frequencies are provided as an exploration reference. Actual physical cymatic patterns depend on the vibrating system, material, geometry, amplitude and experimental conditions.
| Frequency (Hz) | Common Use | Cymatic Effect | Best For |
|---|---|---|---|
| 110 Hz | Deep grounding | Large simple patterns | Relaxation |
| 136.1 Hz | Earth frequency | Stable symmetrical shapes | Meditation |
| 174 Hz | Pain relief tone | Soft wave structures | Physical relaxation |
| 220 Hz | Balance | Clear circular patterns | Focus |
| 285 Hz | Tissue healing | Organic flowing shapes | Healing experiments |
| 320 Hz | Neutral tone | Balanced geometry | Testing baseline |
| 396 Hz | Root chakra | Dense patterns | Fear release |
| 417 Hz | Change frequency | Moving dynamic shapes | Energy shift |
| 432 Hz | Natural harmony | Smooth symmetrical patterns | Meditation |
| 440 Hz | Standard tuning | Slightly sharper patterns | Comparison experiments |
| 480 Hz | Emotional balance | Medium complexity | Stability |
| 528 Hz | Love frequency | Beautiful geometric symmetry | Healing |
| 594 Hz | Heart alignment | Soft balanced forms | Calmness |
| 639 Hz | Connection | Interlinked patterns | Relationships |
| 741 Hz | Detox frequency | Sharp clean shapes | Clarity |
| 768 Hz | Brain activation | Complex patterns | Awareness |
| 852 Hz | Intuition | Expanding geometry | Third eye focus |
| 963 Hz | Higher consciousness | Fine intricate patterns | Spiritual connection |
| 1000 Hz | High energy | Rapid complex structures | Advanced experiments |
| 2000 Hz | Extreme frequency | Tight dense patterns | High vibration testing |
🎯 Why Sound Visualization Matters
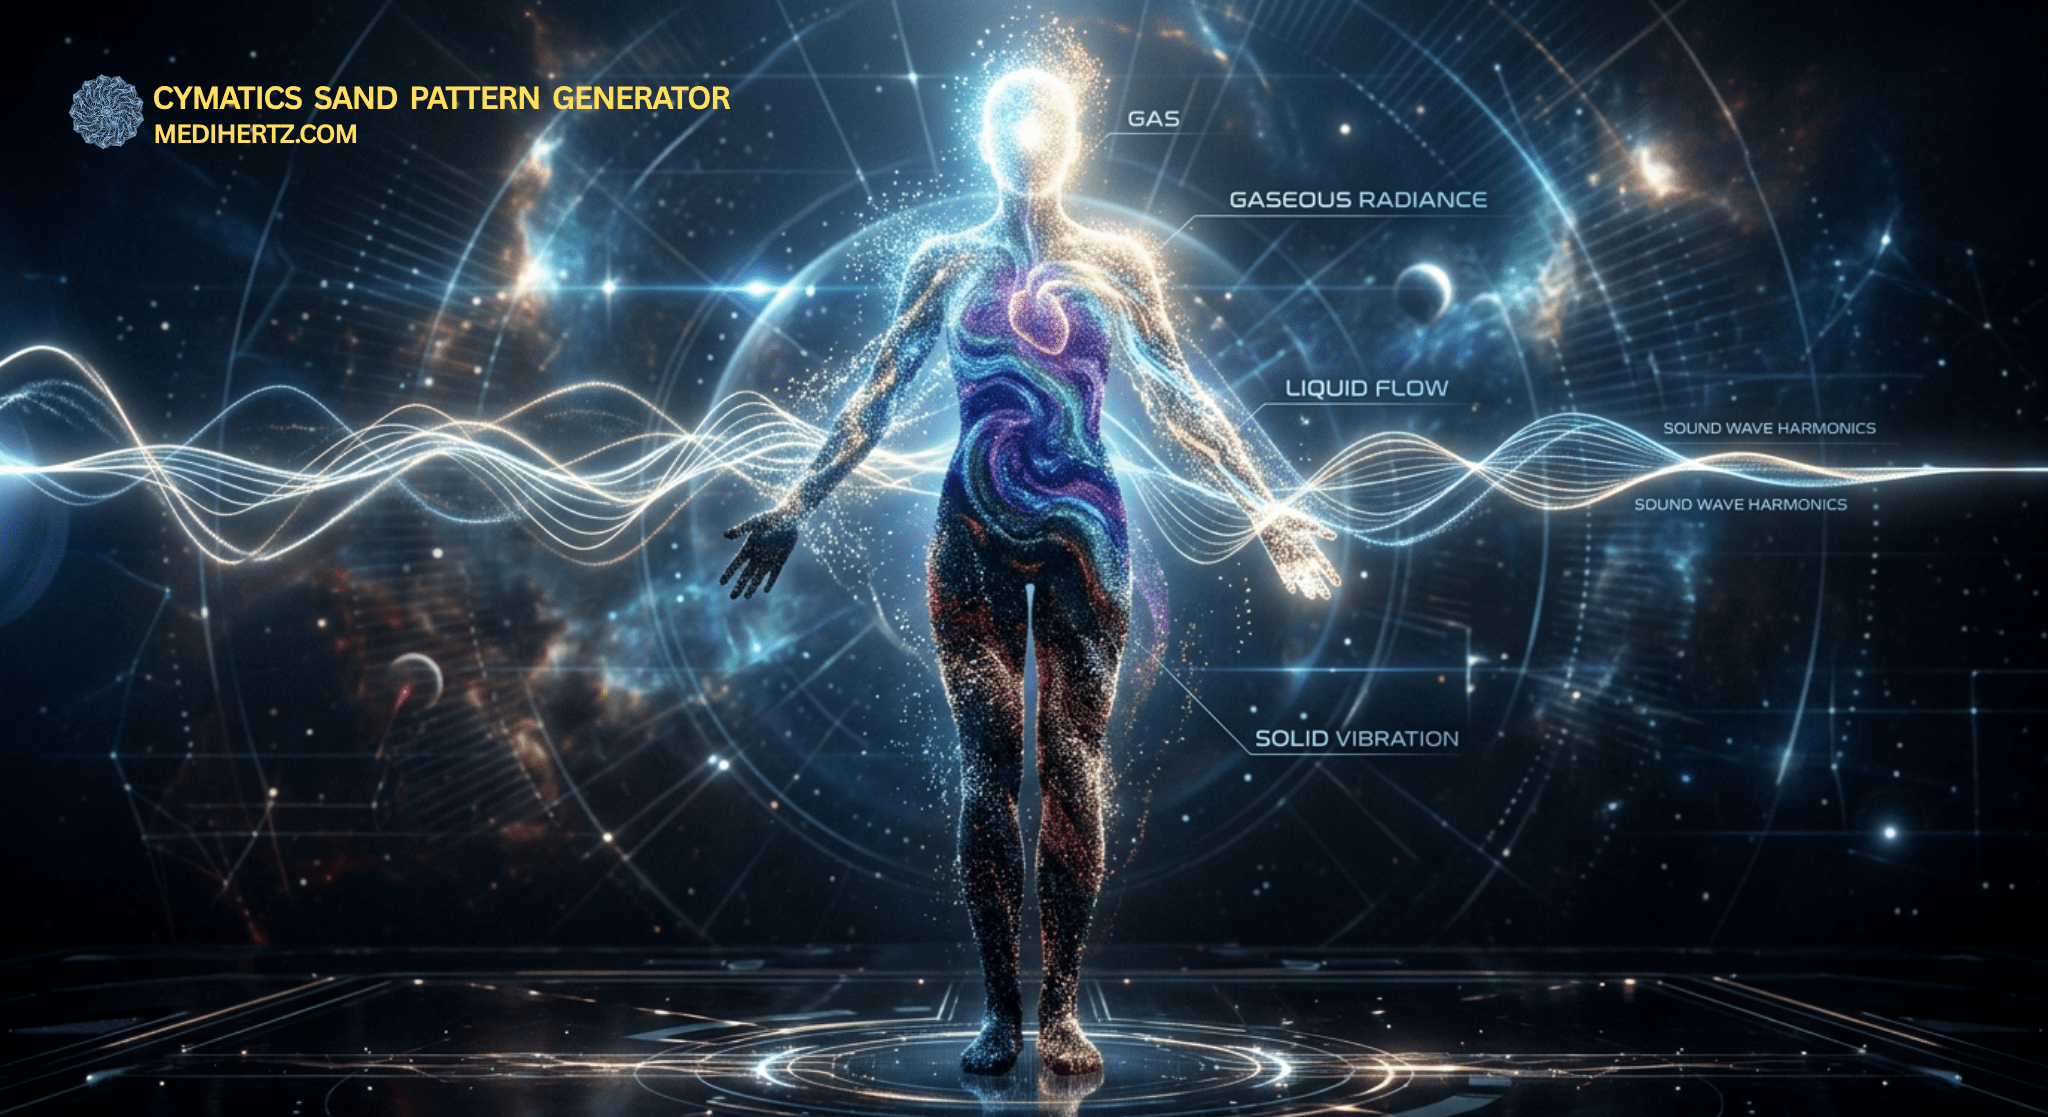
Cymatics gives us an interesting way to think about sound.
Instead of experiencing sound only through our ears, we can explore ways of representing it visually.
The new Audio Input mode makes that experience personal.
You can:
- See your voice
- Explore sound frequencies
- Visualize music
- Experiment with mantras
- Compare tones
- Explore noise
- Observe room ambience
- Study vibration
- Experiment with Chladni-inspired patterns
Most importantly, the tool encourages curiosity.
Don’t just hear the sound. Explore it.
🎧 What Can You Use the Cymatics Visualizer For?
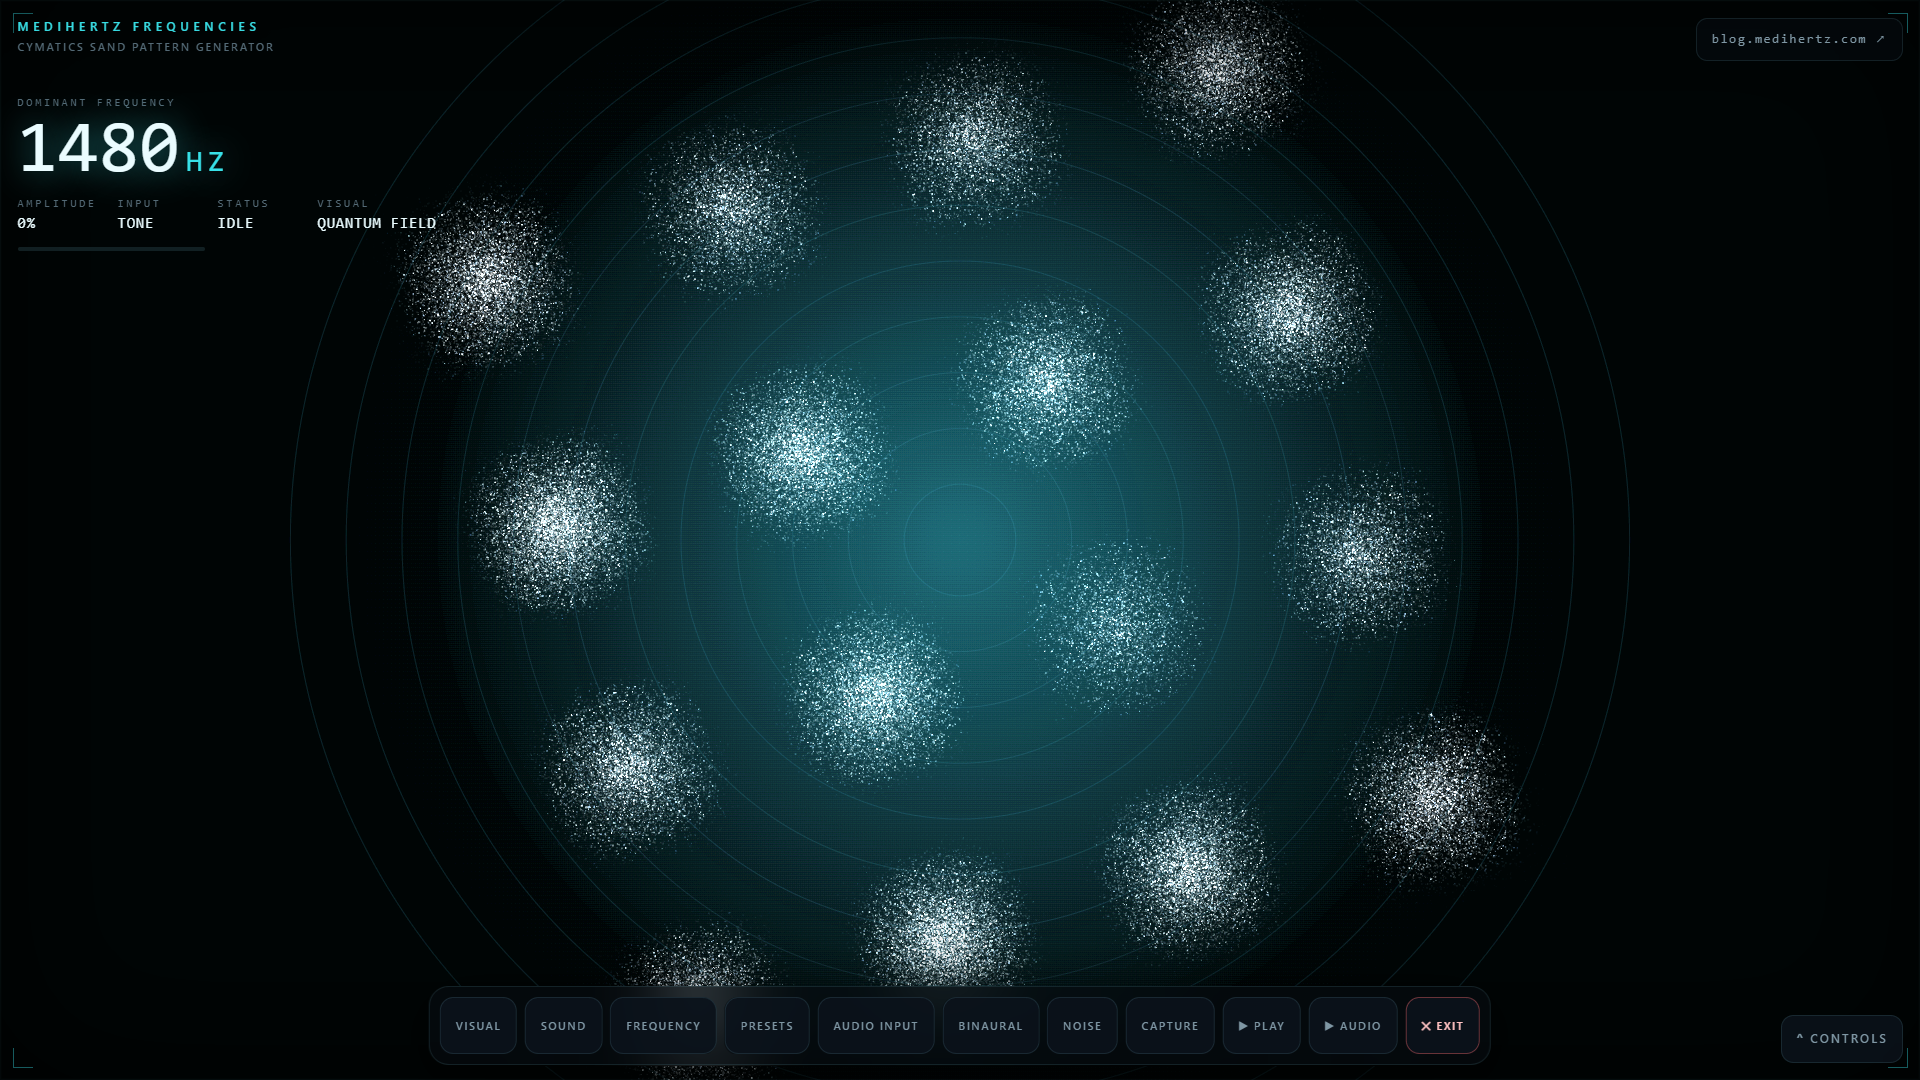
The tool can be used for many different audio experiments:
Voice frequency test
Speak into the microphone and explore your changing voice frequency.
Sound visualization
Turn incoming audio into an interactive visual experience.
Audio waveform exploration
Observe how sound changes over time and compare different audio sources.
Music experiments
Play music and watch the visualization respond to complex audio.
Mantra and chant experiments
Speak or play chants and observe their changing frequency content.
Noise experiments
Compare white noise, pink noise, brown noise and environmental sounds.
Binaural-beat experiments
Use stereo headphones to explore left/right audio differences.
Cymatics experiments
Generate frequencies and explore digital cymatic-style patterns.
Education
Use the tool to demonstrate basic concepts involving frequency, vibration, sound waves and resonance.
🔧 Explore More Medihertz Frequency Tools
If you enjoyed exploring sound visually, you can continue experimenting with other frequency and audio tools from Medihertz Frequencies.
Your existing links can remain.
I would especially keep and prioritize:
- Vocal Pitch & Ear Scale Trainer
- Instant Hz Listener
- Hz Frequency Generator
- White Noise & Binaural Beats Generator
- Om Chanting Meditation Tool
- TuneNaad
- Medihertz Studio
✅ FAQ
❓ What is a voice frequency analyzer?
A voice frequency analyzer is a tool that analyzes the audio signal from your voice and displays frequency information. Because human speech changes continuously, the detected frequency can change as you speak, sing or hum.
❓ How do I know my voice frequency?
Select Audio Input, allow microphone access and speak or hum into your microphone. The tool analyzes the incoming audio and displays detected frequency information.
❓ How can I measure my voice frequency online?
You can use a browser-based voice frequency analyzer that has microphone access. Speak into the microphone and observe the frequency information detected from your voice.
❓ What is my voice frequency?
Your voice does not have one single permanent frequency. Different sounds, pitches, vowels and speaking styles produce different frequency components.
❓ How many Hz is my voice?
Your voice contains a range of frequencies that change continuously. A frequency analyzer can display a detected or dominant frequency at a particular moment.
❓ Can I check my voice frequency on my phone?
Yes. If your mobile browser supports microphone access, you can use Audio Input to explore your voice frequency directly from your phone.
❓ Can I see my voice frequency online for free?
A browser-based audio analyzer can let you explore your voice frequency without installing a separate application, subject to browser microphone permissions.
❓ How do I see what Hz my voice is?
Open Audio Input, allow microphone access and speak or hum. The analyzer will display frequency information detected from the incoming audio.
❓ What is sound visualization?
Sound visualization is the process of representing audio information visually. Waveforms, frequency spectra, spectrograms and audio-reactive graphics are examples of sound visualization.
❓ How can you visualize sound?
Sound can be visualized by analyzing characteristics such as amplitude and frequency and converting those measurements into visual graphics.
❓ What is an audio waveform?
An audio waveform is a visual representation of how an audio signal changes over time.
❓ What is an audio visualizer?
An audio visualizer is a graphic system that responds to characteristics of an audio signal and represents them visually.
❓ Can I visualize my voice?
Yes. With Audio Input, you can use your microphone to capture your voice and watch the visualizer respond to the incoming sound.
❓ Can I visualize music?
Yes. You can experiment with music through the available audio input method and observe how the visualization responds to complex audio.
❓ Can I use a mantra or chant?
Yes. You can speak or play a mantra, chant or other vocal sound through the available audio input and observe its changing frequency response.
❓ Can I analyze room noise?
Yes. Audio Input can capture sounds reaching your microphone, including ordinary room ambience. The displayed frequency information depends on the microphone and surrounding environment.
❓ Can I use headphones?
Yes. Headphones are especially useful for stereo experiments and binaural beats. A headset with a microphone can also be convenient for voice-frequency experiments.
❓ What are binaural beats?
Binaural beats are an auditory phenomenon created when slightly different tones are presented separately to the left and right ears. Stereo headphones are normally required to maintain channel separation.
❓ Who is the father of cymatics?
Ernst Chladni is considered the father of cymatics. He discovered how sound creates patterns on vibrating plates (Chladni patterns).
❓ How do cymatic frequencies work?
Cymatic frequencies work by creating vibrations that organize particles like sand or water into visible patterns. Each frequency produces a unique shape, which is why cymatics experiments visually show how sound affects matter.
❓ What is 20 Hz to 20,000 Hz called?
This range is called the human hearing range. It includes all frequencies most people can hear. Cymatics experiments often use frequencies within and beyond this range to create patterns.
❓ What are frequency patterns?
Frequency patterns are shapes formed when sound vibrations interact with matter. In cymatics, these are known as cymatic patterns, and each frequency creates a different geometric design.
❓ Do vibrational frequencies actually work?
Yes, vibrational frequencies work physically by affecting matter through movement and resonance. Cymatics proves this visually. Their effects on mood and healing are widely used, though personal experiences may vary.
❓ What are the 9 sacred frequencies?
The 9 sacred (Solfeggio) frequencies are:
174 Hz, 285 Hz, 396 Hz, 417 Hz, 528 Hz, 639 Hz, 741 Hz, 852 Hz, 963 Hz
These are commonly used for meditation, relaxation, and sound healing.
❓ What does 432 Hz do to your brain?
432 Hz is believed to promote calmness and balance. Many people feel relaxed when listening to it. In cymatics, it creates smooth and harmonious patterns.
❓ Can a human hear 30,000 Hz?
No, 30,000 Hz is above the human hearing range. It is called ultrasound and cannot be heard but can still affect matter in experiments.
❓ Can humans hear 21,000 Hz?
Most humans cannot hear 21,000 Hz. The typical upper limit is around 20,000 Hz, and it decreases with age.
❓ What is hypersonic sound?
Hypersonic sound refers to extremely high-frequency sound waves beyond human hearing. These frequencies are used in advanced scientific and acoustic research.
❓ What does 432 frequency do?
The 432 Hz frequency is associated with relaxation, emotional balance, and natural harmony. It is widely used in meditation and sound therapy.
❓ Is cymatics a real science?
Yes, cymatics is a real science that studies how sound vibrations create patterns in matter. It is based on physics and wave behavior.
❓ What are the 5 types of vibration?
Common types of vibration include:
- Free vibration
- Forced vibration
- Damped vibration
- Undamped vibration
- Resonant vibration
These help explain how cymatic patterns are formed.
❓ What are the 4 types of vibration?
The main four are:
- Free vibration
- Forced vibration
- Damped vibration
- Resonance
These are core concepts in sound and cymatics.
❓ What is 3X vibration?
3X vibration usually means three times the base vibration speed or frequency. It is often used in simple terms to explain faster oscillation or energy levels.
❓ What is 20 vibrations in 2.5 seconds?
Frequency = vibrations ÷ time
👉 20 ÷ 2.5 = 8 Hz
So, the frequency is 8 Hz.
❓ What is 1X, 2X, 3X vibration?
These represent multiples of a base frequency:
- 1X = original frequency
- 2X = double frequency
- 3X = triple frequency
They are often used in vibration and resonance studies.
❓ What are the 6 modes of vibration?
The six modes usually refer to different ways an object can vibrate, including:
- Longitudinal
- Transverse
- Torsional
- Bending
- Surface vibration
- Resonant modes
These influence how cymatic patterns form.
❓ How many vibrations is 1 Hz?
1 Hz means one vibration per second.
❓ What is a vibration below 20 Hz called?
It is called infrasound. Humans cannot hear it, but it can still influence matter and environments.
❓ What emotions are high frequency vibrations?
High-frequency states are often linked to:
- Love
- Joy
- Peace
- Clarity
These are commonly associated with meditation and positive energy.
❓ What is natural frequency in vibration?
Natural frequency is the frequency at which an object naturally vibrates. In cymatics, different materials respond differently, creating unique patterns.
❓ How do cymatics affect the human body?
Since the human body contains solid, liquid, and gas, sound vibrations can influence it. Many people use frequencies for relaxation, focus, and meditation.
❓ What is the theory of cymatics?
Cymatics is based on the idea that sound vibrations can organize matter into patterns. It shows how frequency shapes physical structures.
❓ What are cymatics used for?
Cymatics is used in:
- Science experiments
- Sound therapy
- Meditation
- Art and design
- Acoustic research
❓ What does 1000 Hz do to the brain?
1000 Hz is a higher frequency that may increase alertness and focus. In cymatics, it produces more complex patterns.
❓ Are we 99.9999% empty space?
Scientifically, atoms are mostly empty space, so in a way, yes. This idea connects with how vibration and frequency influence matter.
❓ Is cymatics legal?
Yes, cymatics is completely legal. It is a scientific and artistic field used worldwide.
❓ Can a human hear 20,000 Hz?
Yes, but only at a young age. Most adults cannot hear frequencies this high.
❓ Is there any science behind healing frequencies?
There is scientific evidence that sound vibrations affect matter and the brain. Cymatics proves physical effects, while healing benefits are still being researched.
❓ What is God’s frequency in Hz?
Some people refer to 528 Hz or 963 Hz as “God frequency,” but this is a spiritual belief, not a proven scientific fact.
❓ Do humans have 70,000 thoughts per day?
This is a popular estimate, but not scientifically proven. It is often used to describe how active the human mind is.
❓ What is the forbidden frequency?
There is no scientifically proven “forbidden frequency.” This term is mostly used in myths or internet theories.
❓ What is Dark Sky Cymatics?
Dark Sky Cymatics is generally a creative or artistic concept combining sound visualization with cinematic visuals, not a scientific term.
❓ Can cymatics be used in art?
Yes, cymatics is widely used in art to create beautiful patterns and visual designs based on sound vibrations.
❓ Is cymatics a science?
Yes, cymatics is a scientific study of sound and vibration patterns, closely related to physics and acoustics.
❓ What is Cymatics Ocean Pluck?
It is usually a sound or music sample inspired by cymatic-style frequencies and wave patterns, often used in audio production.
Audio Input Disclaimer:
The microphone mode analyzes sound captured by your device microphone. It does not directly measure physical vibration inside the human body, brain or other biological tissue. Frequency readings can vary depending on the microphone, distance, background noise, room acoustics and device hardware.
The displayed frequency should be treated as an audio-analysis result for educational and experimental purposes. The tool does not diagnose health conditions or determine whether a frequency is medically beneficial, harmful or therapeutic.
Never use the tool to intentionally expose yourself, another person or an animal to excessively loud sound.
🔗 Explore More Medihertz Tools
🔊 Healing Frequency ToolS
- Vocal Pitch & Ear Scale Trainer
- Find Your Tinnitus Frequency Online
- TuneNaad 🎸
- Daily Weight Loss Frequencies
- Instant Hz Listener
- Hz Frequency Generator (Advanced)
- Find Your Tinnitus Frequency Online
- Om Chanting Meditation Tool
- CatPurrTone Tool
- Third Eye & Chakra Alignment Frequency Tool
- SENCAR Focus Waves for Driving, Travel & Long Focus Sessions 🔴🚘
- TradeMind Frequency Analyzer – for Traders
- White Noise & Binaural Beats Generator Free
- CampHertz: A Camping Sound Guard for Night Protection
Utility Tools
- Calm Online Notepad with Auto Save
- CalmMind Quiz
- Manifestation Tools
- Magic Ball Prediction Tool
Related Frequency Articles- 👇
- 👉Complete Guide to Brainwave Frequencies (Hz Explained Simply)
- 👉 The One Frequency You Must Avoid in 2026 (Based on Your Birth Number)
- 👉What is the science behind sound bowls?
- 👉What is 7 Hz good for? A careful, evidence-based guide (with references)
- 👉Cymatics: From 2D Sand Patterns to 3D Sound Sculptures
- 👉 Hz Frequency Generator- Free Online Tone Generator
- 👉 What Frequencies Are Dangerous to Humans? Understanding Risks from Sound to Radiation
- 👉How to do a Cymatic Experiment
- 👉What is the science behind cymatics?
- 👉 NASA-Approved 30-Min Brain Boost
- 👉 What Is The Healing Power Of Sound Wave
- 👉 What does 528 hz do to the brain?
- 👉 The 7 Healing Frequencies: Unlocking the Power of Sound for Wellness
- 👉 The Sacred Science of Yantras: How Cymatics Validates Ancient Tantric Geometry
- 👉 Is 1111 a Lucky Number? A Deep Dive into Its Mystical, Numerological, and Cultural Significance
- 👉 Is 528 Hz Dangerous?
- 👉Delta Waves (0.5–4 Hz): Effects on Mind, Sleep, and Spiritual Energy
- 👉What Happens to Your Brain at 1 Hz Frequency?
- 👉Complete Guide to Brainwave Frequencies (Hz Explained Simply)
- 👉 White Noise for Sleep – Fall Asleep Fast (Free Online Tool)
- 👉 Is It Good to Sleep With White Noise? (Simple Guide for Better Sleep)
☸